Arctic Projections with Leaflet and React
Maps in web applications are a pretty common feature these days, and with amazing libraries like Leaflet its now pretty easy to build a great mapping experience.
Typically these maps use the Web Mercator projection, a variant of the Mercator projection most people are familiar with from paper maps and which has been in common usage for hundreds of years.
The Mercator projection takes our spherical world and maps (projects) it to a rectangle, which is very convenient for viewing on a rectangular sheet of paper or screen, but produces a distorted view of the world that inflates the size of objects near the poles.
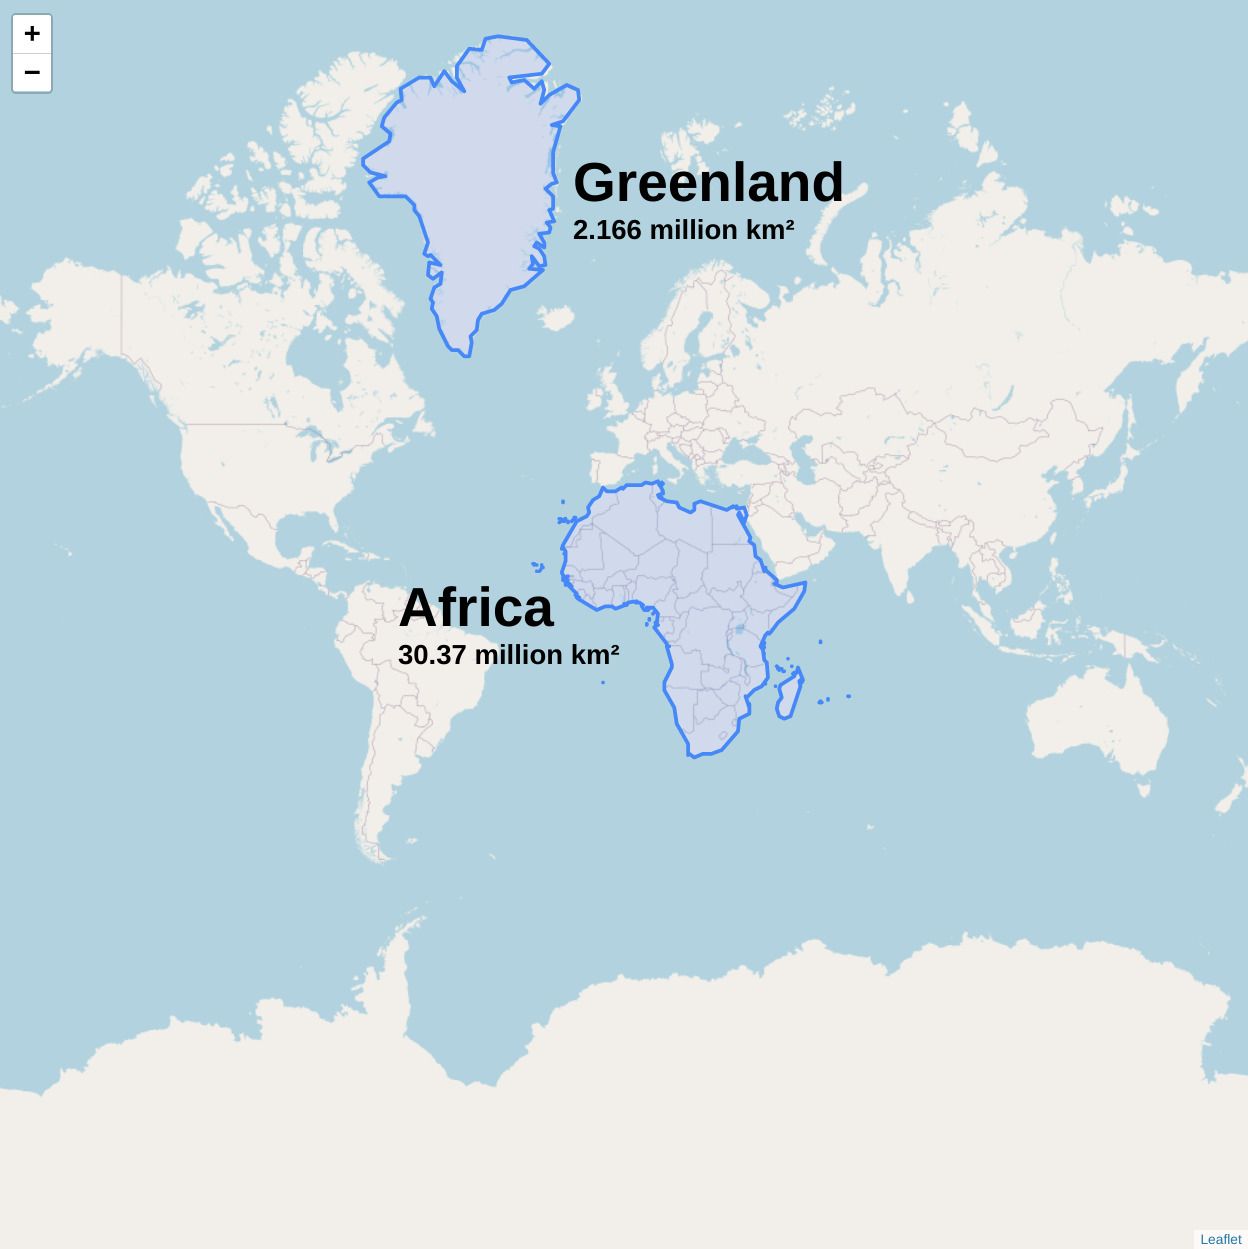
Likewise, things near the pole that are close together in reality can appear to be far apart, and it is very difficult to visualise the proximity of objects in the Arctic Circle when viewed on Mercator projected maps.
Luckily, it is possible to render maps on the web using alternative projections, although it can be tricky to get up and running. In this post we’ll have a look at setting up an Arctic projection with React, Leaflet, and Proj4js (via Proj4Leaflet).
First lets get a map up and running with the default Web Mercator projection, then we’ll walk through the modifications necessary to display an Arctic projection.
Mapping with React + Leaflet
Getting started with the default projection is straight-forward — we just need to set up a container for our map and render a TileLayer with a suitable tile provider url. As we’re just testing we’ll use tiles from openstreetmap using the following url pattern.
const TILES = https://{s}.tile.openstreetmap.org/{z}/{x}/{y}.png
The code to render the map with React-Leaflet is short and sweet:
import { MapContainer, TileLayer } from "react-leaflet";

const App = () => (
  <MapContainer
    style={{
      width: 1000,
      height: 1000
    }}
    center={[0, 0]}
    zoom={2}
    minZoom={1}
  >
    <TileLayer url={TILES} />
  </MapContainer>
)

export default App;
That’s all we need to render a world map in Mercator projection. Here it is in codesandbox:
Now that we have a map rendering in Mercator projection, lets convert it to a polar projection, specifically the Arctic Lambert Azimuthal Equal Area projection (Arctic LAEA for short). To do that we need to provide Leaflet with two things:
- a coordinate reference system (CRS) to enable it to project and unproject coordinates, and
- a set of tile images are appropriate for that CRS
The CRS implementation comes courtesy of Proj4Leaflet, and must be parameterised with a proj4 configuration string and details of the map tile bounds and resolutions.
Proj4 configuration
We can find the proj4 configuration string at epsg.io simply by searching for the projection we want to use. There are several Arctic LAEA projections we could use, I’m going to go ahead with epsg:3575. The configuration string we need can be found under the section titled “Export” for the proj4js link, which gives the following:
proj4.defs(
  "EPSG:3575",
  "+proj=laea +lat_0=90 +lon_0=10 +x_0=0 +y_0=0 +datum=WGS84 +units=m +no_defs"
);
Map Tile Configuration
Next, we’ll need a compatible set of tiles for the EPSG:3575 projection. I’m going to use tiles hosted by the Global Biodiversity Information Facility. The map tile url pattern is given on that page as:
https://tile.gbif.org/{srs}/{tileset}/{z}/{x}/{y}{format}{params}Here, {srs} is the spatial reference system (in our case 3575), {tileset} can only be omt, {format} allows for a choice of vector or various resolutions of png (i’ll use @4x.png), and {params} allows us to choose a tile style - only for png tiles - where i’ll use ?style=gbif-classic, which altogether gives us a tile url like this:
https://tile.gbif.org/3575/omt/{z}/{x}/{y}@4x.png?style=osm-bright-enWe need to provide the CRS with a little configuration related to the map tiles, which we can derive from the extents provided by Global Biodiversity Information Facility (see the table in the usage section). The tiles are 512x512 and the provided extents for the northern hemisphere are:
–6371007.2 √2, 6371007.2 √2, 6371007.2 √2, –6371007.2 √2So we can derive the extent and resolutions like this:
const MAX_ZOOM = 16;
const TILE_SIZE = 512;

const extent = Math.sqrt(2) * 6371007.2;
const resolutions = Array(MAX_ZOOM + 1)
  .fill()
  .map((_, i) => extent / TILE_SIZE / Math.pow(2, i - 1));
Complete Proj4Leaflet Configuration
Putting it all together we get the following:
const MAX_ZOOM = 16;
const TILE_SIZE = 512;

const extent = Math.sqrt(2) * 6371007.2;
const resolutions = Array(MAX_ZOOM + 1)
  .fill()
  .map((_, i) => extent / TILE_SIZE / Math.pow(2, i - 1));

export const ARCTIC_LAEA = new Proj.CRS(
  "EPSG:3575",
  "+proj=laea +lat_0=90 +lon_0=10 +x_0=0 +y_0=0 +datum=WGS84 +units=m +no_defs",
  {
    origin: [-extent, extent],
    bounds: L.bounds(
      L.point(-extent, extent),
      L.point(extent, -extent)
    ),
    resolutions: resolutions
  });

const ARCTIC_TILES_URL =
  "https://tile.gbif.org/3575/omt/{z}/{x}/{y}@4x.png?style=osm-bright-en";
All that remains is to update MapContainer to refer to the new CRS and center on the pole.
crs={ARCTIC_LAEA}
center={[90, 135]}
... modify TileLayer to use the arctic tiles ...
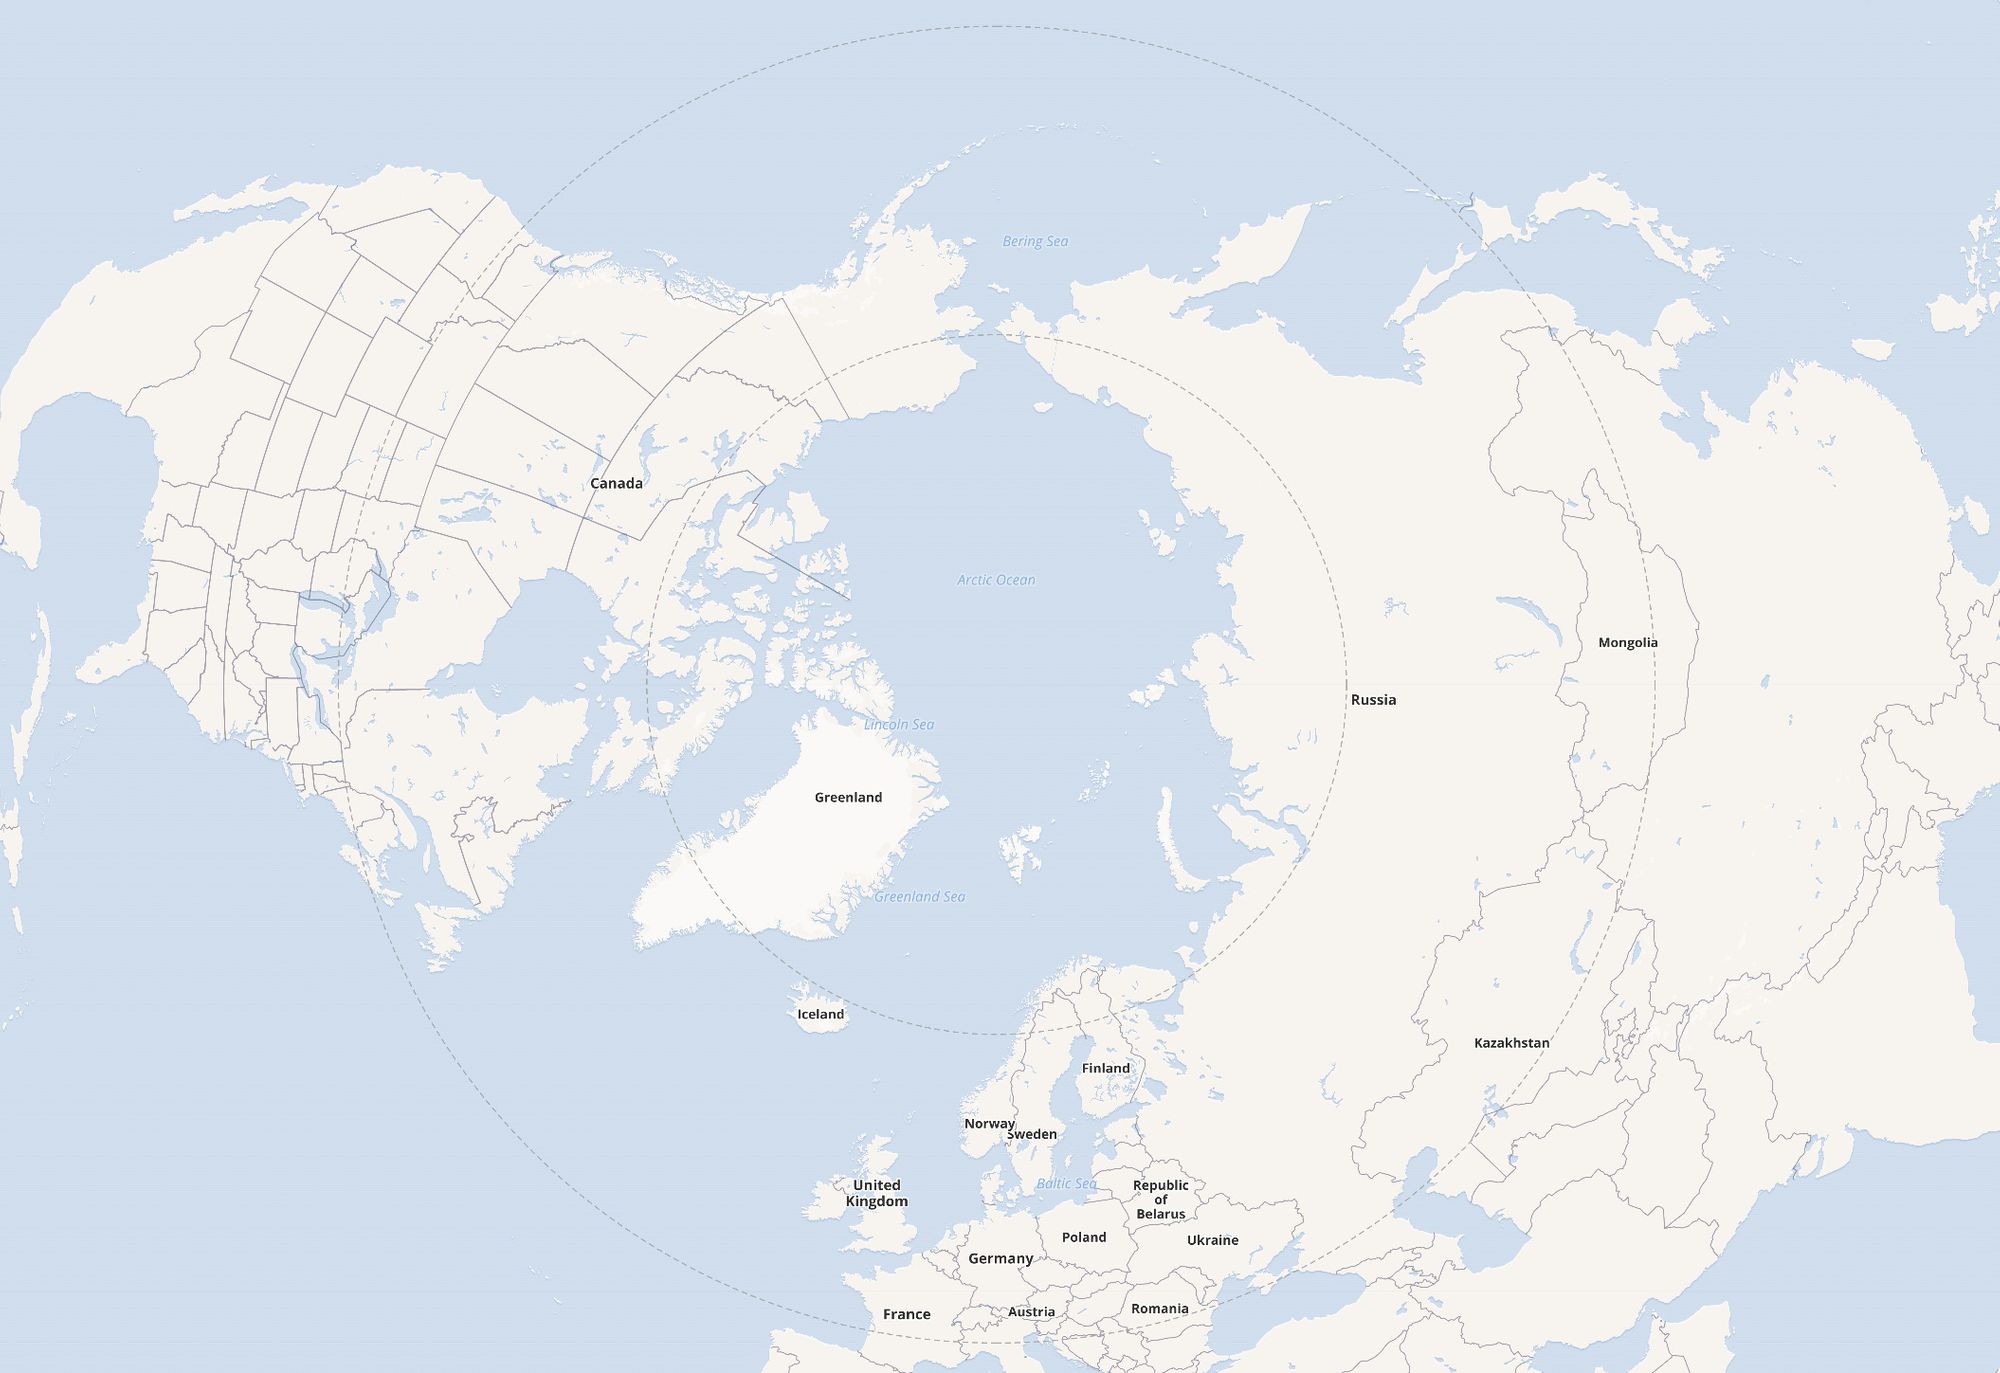
url={ARCTIC_TILES_URL}And we’re done! Check out the complete working code on codesandbox.
Welcome to the Arctic!