Creating a Knowledge Graph in 12 minutes at Ontotext’s Knowledge Graph Forum
Last week we presented a talk at the online Knowledge Graph Forum hosted by Ontotext. Here’s an overview of our objectives for this talk, and a summary of some of the things we spoke about.
Our Aim
We assumed that our audience were people who were either interested or actively working on knowledge graphs and feeling their way through the problem space.
Our main aim therefore with this presentation was to show the amazing capabilities of our own knowledge graph product Data Graphs, and how quickly it helps you create a knowledge graph for a domain.
Common Knowledge Graph Challenges
Before we started with the process of building the knowledge graph, we wanted to highlight three main challenges that previous clients had raised time and time again when faced with this task:
1. Semantics in your Knowledge Graph
If you start using an enterprise graph database and RDF, the semantics can get complicated quickly and it can be easy to get bogged down in a lot more complexity than you actually need. The core question then is: ‘How much semantics is enough?’. One of our main objectives for this talk was to show that we believe Data Graphs has just the right amount of semantics to demonstrate how we can lower the barrier of entry for knowledge graphs.
2. Technologies
There's a whole suite of technologies which are generally new to most organisations, they don't have this expertise internally around RDF and semantics.
3. Insufficient Information Management
Many of the knowledge graph initiatives that we see are technology-driven. Many companies buy the knowledge graph technology, overlooking the essential information management side of things. Your knowledge graph is only as good as your domain model and this must be made up of well curated data. Often companies that have a knowledge graph will have neglected their information management and the data quality is poor. We'll return to this later.
The Main Act
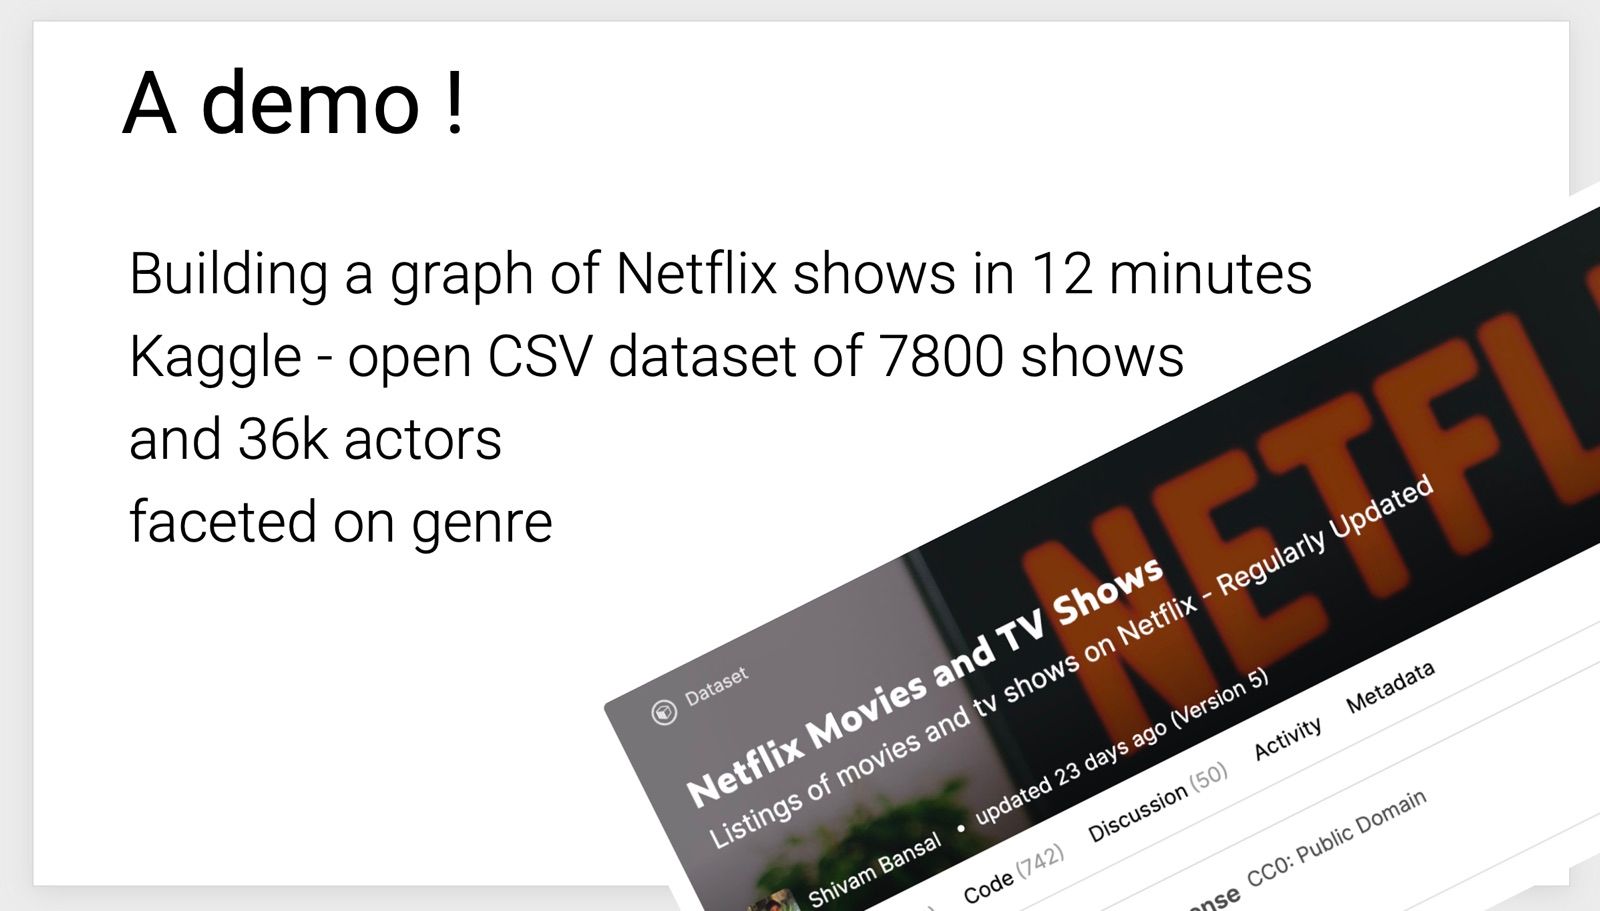
We took attendees through a step by step process of creating a knowledge graph in just 12 minutes with Data Graphs, using the open source data that Netflix has made available on Kaggle. We started by showing the domain model that we wanted to replicate and then began the process of building the knowledge graph.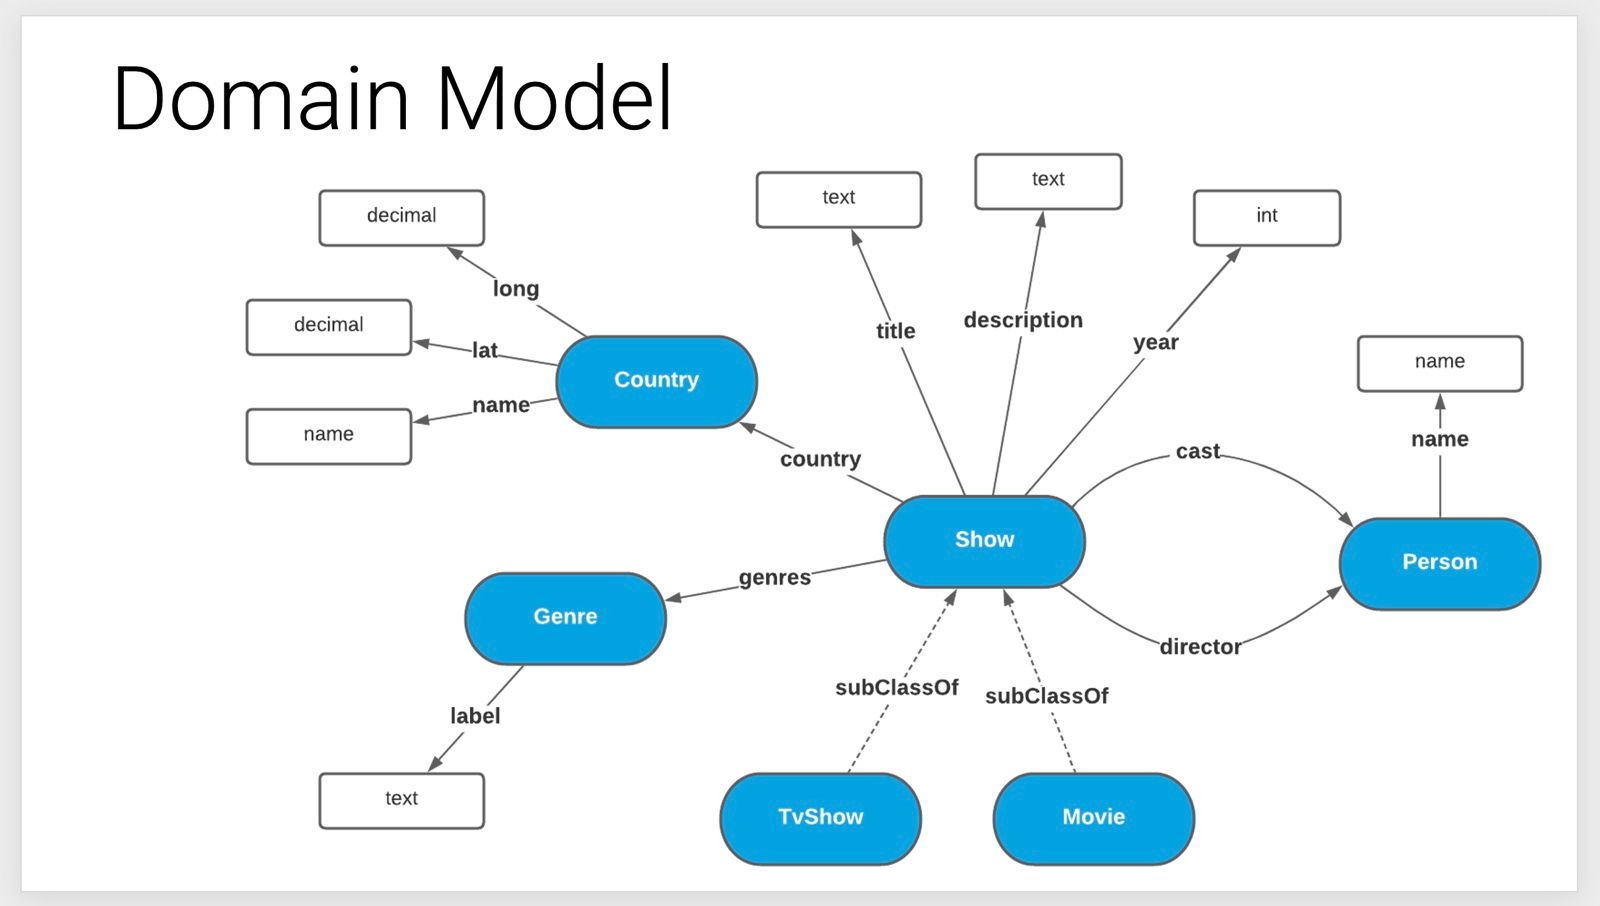
The first step was to create datasets and concept classes, which is effectively our project canvas. Then using Data Graphs’ schema builder we can replicate our domain model. We built out the classes and their relationships and then finally we have a visual view of our domain model, replicated within Data Graphs. The next step was to load in the data. Taking individual CSV files prepared from the Kaggle Netflix data we populated our domain model one concept class at a time, and let Data Graphs stitch them together with identifiers that we had predefined. Once all the data was loaded we had a ‘big reveal’, through the Data Graphs explorer which allows you to navigate and visualise your knowledge graph.
The audience was able to see all Netflix’ data on movies, shows, actors, directors, countries etc. presented in an interconnected, structured, and manageable way.
The Rewards
The rewards can be reaped immediately. Directly within the UI for Data Graphs you can start giving people access to it to explore, search, query and facet the data conforming to your domain model. You can also use immediately use the Data Graphs APIs to build your own applications on top of the data.
Key Message? Preparation Before Creation
The key message we were trying to impress on our audience was that for knowledge graphs, good preparation is essential. The speed and relative simplicity of the setup that we had demonstrated was only possible with solid information preparation - data that was already clearly structured and well organised. Pre-defining your domain model is an essential step in establishing the shape of your data before embarking on a knowledge graph project. Many people jump into ontologies well too quickly without spending enough time thinking about the specifics of their data, the core entities in your domain, the key relationships between them that will enable to you to answer the right questions of your data.
For example, in our case, before this talk we had gone through several questions that we knew we would need to know the answers to when creating the knowledge graph:
- What will the shape of the data be?
- What ubiquitous language should we use to describe our model?
- What identifiers will each of the data points have?
- What sort of questions will be want our knowledge graph to answer?
- What will the pros and cons of different approaches be?
And so on...
Making those decisions upfront and doing the work outside of the technology was essential in allowing that knowledge graph creation to run smoothly. This preparation is agnostic to the technology solution so once that is aligned, if you have the right tool, which in this case was Data Graphs, it becomes simple to put it all together. When that thinking doesn’t happen before the process of creating a knowledge graph starts, you end up having to work out many imperative and foundational design decisions within your already-chosen technology and thus implementation becomes more complex.