Reflections and Insights from the Knowledge Graph Conference 2022
Taken from our newsletter which you can subscribe to here.
Last week we presented our knowledge graph product, Data Graphs at The Knowledge Graph Conference at Cornell Tech on Roosevelt Island, New York.
Based on the presentation topics and workshops at the conference, and backed up by the "2nd Annual Knowledge Graph Survey", here are our 3 takeaway messages for you:
Takeaway 1: Organisations are struggling to get started
We heard a lot about the challenges of skills gaps, organisational inertia, and governance gaps, and that when trying to adopt knowledge graphs, many organisations just don’t know where to start. This is reflected in the 2nd Knowledge Graph Annual Survey with 86% of responses saying that 'Organisational Inertia' was an important inhibitor to their adoption of knowledge graphs.
Organisations can break through the inertia by using a reference implementation
Our preferred approach to breaking through this inertia is to build a reference implementation rapidly. Using Data Graphs, you can have a working reference implementation ready within a day - we did it in 13 minutes here.
A working reference implementation has 3 main benefits:
- It helps stakeholders grasp the value of data meaning and interconnection, hands-on.
- Seeing the knowledge graph visually, and being able to explore it by simply clicking from node to node sparks new ideas for all disciplines.
- A working version gives teams a real basis on which to iterate and answer key questions, including “What KG features do we need?”, “What model works well?”, “What kind of inference and path analysis do we need?”, and more.
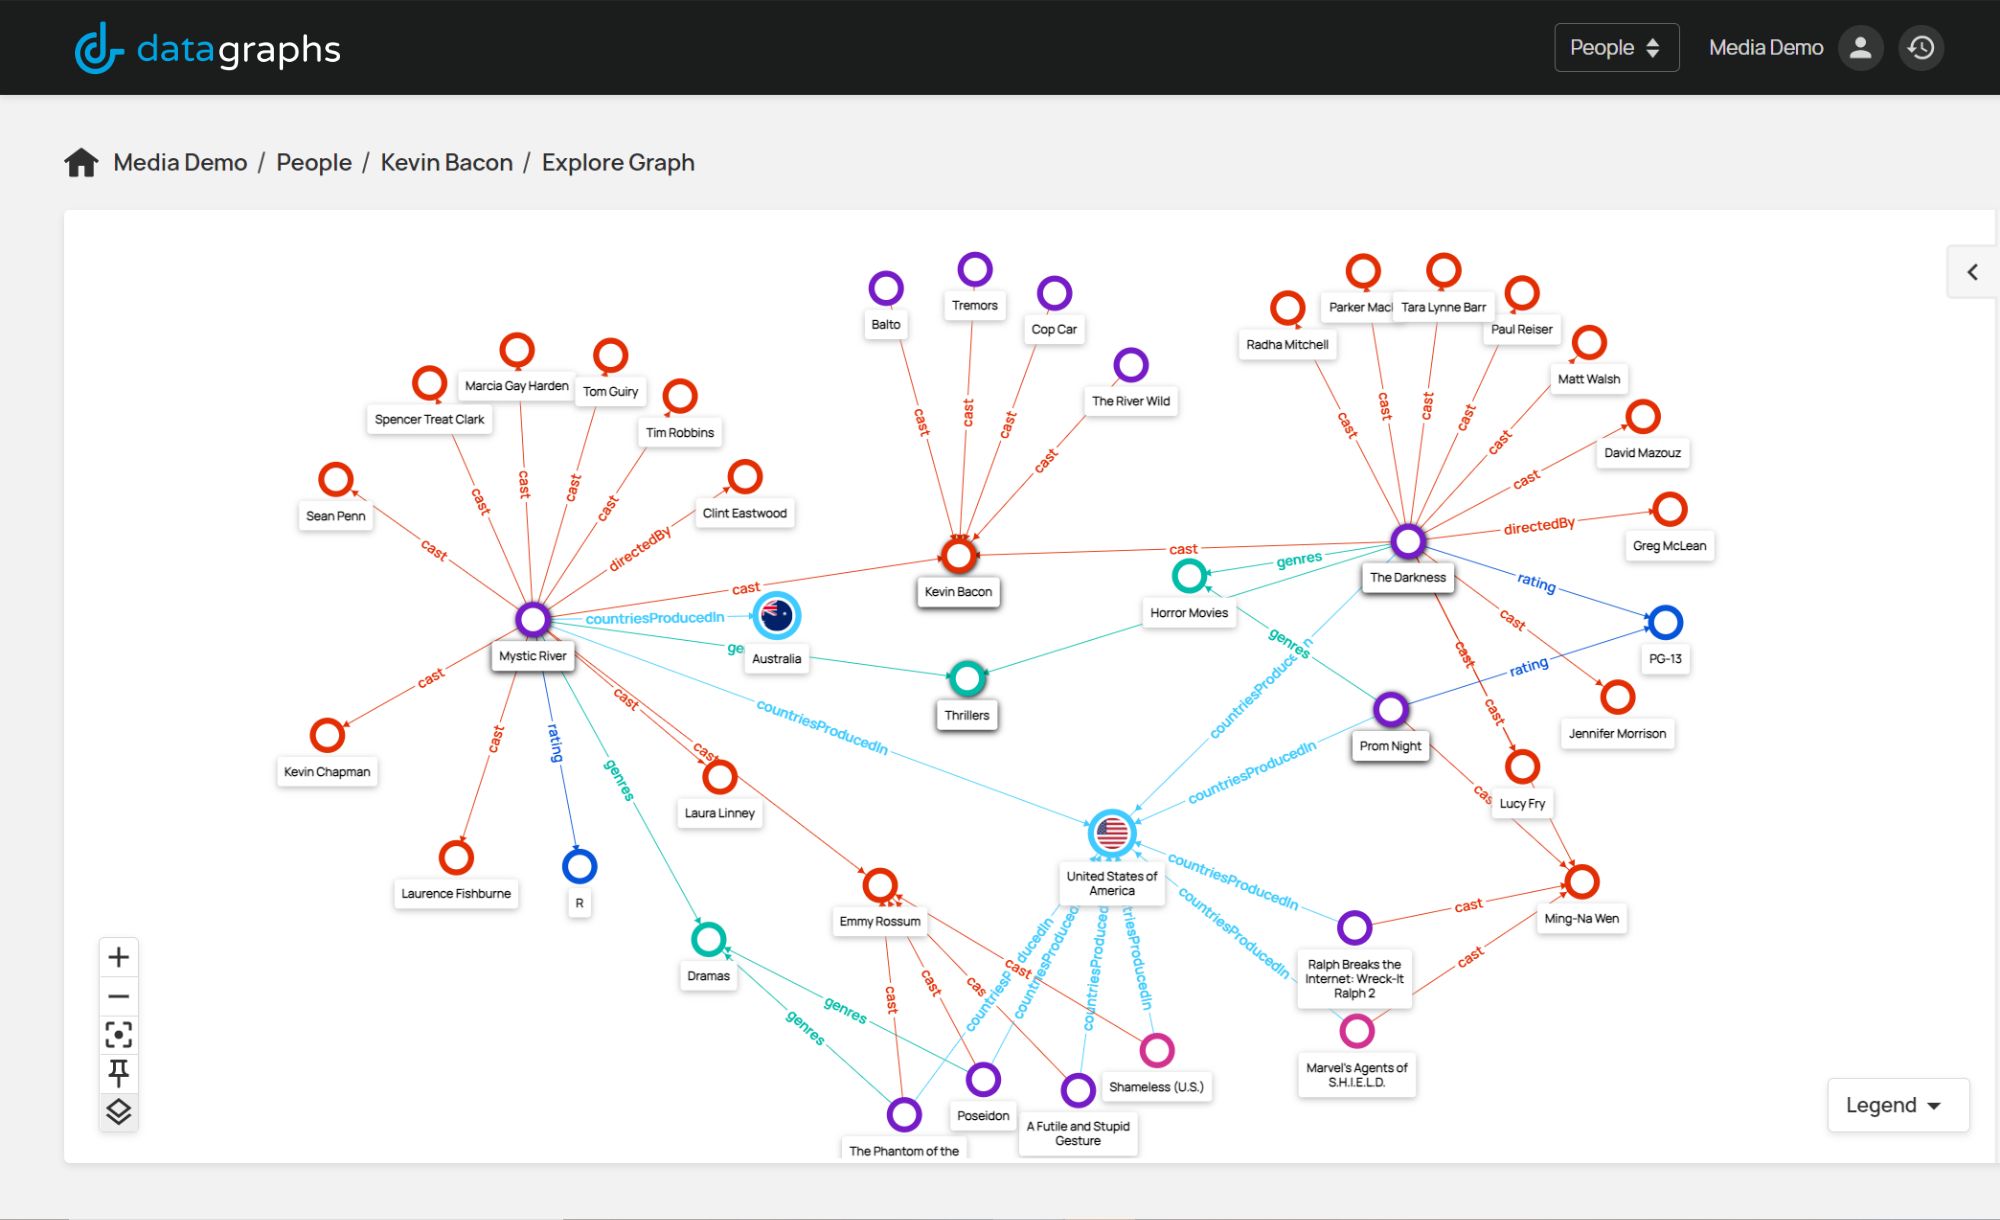
Have a look at the Knowledge Graph Explorer feature of our product Data Graphs below. A reference implementation like this helps organisations to break through the inertia, and save time spent wallowing in indecision.
Knowledge Graph Explorer
Takeaway 2: Organisations are looking for key features to enable their plans
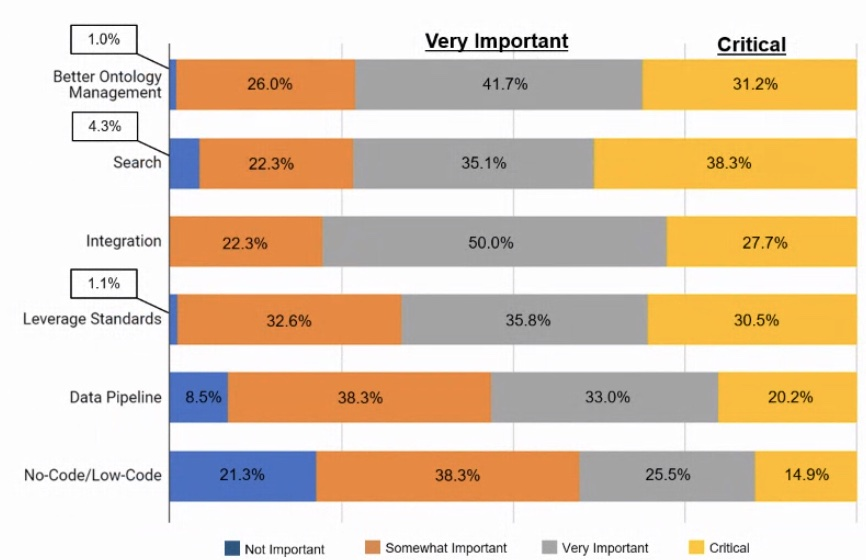
In this slide from the KG Annual Survey, you can see the areas here that reflect what knowledge graph users are interested in, for example 'Search', 'Better Ontology Management', 'Integration' and 'No-Code/Low-Code'.
Features of interest to KG Survey Respondents
Search
Data Graphs' Advanced Search feature allows you to build complex queries by chaining and grouping a series of boolean and numeric expressions.
Try Data Graphs' Advanced Search here
Better Ontology Management
This area has always been complex and somewhat expert-dependent. "No code" schema development is now in demand. In our demo, you can see the domain model (the output of our no-code custom schema tools) for shows on Netflix, Disney+, Amazon Prime Video, and Hulu.
Try Data Graphs' Domain Model here
Integration
Using APIs and webhooks, how can we help developers integrate with minimum friction? This step-by-step guide shows how to set up your knowledge graph quickly and effectively.
Building a Knowledge Graph: Step by Step Guide
No-Code/Low-Code
How might businesses get their knowledge graph up and running without having to dedicate engineers to coding? The tools in this space are improving, and you can see how we set up a knowledge graph with Data Graphs using data from Netflix, with APIs and fully featured management UI production-ready, in 12 minutes here.
Creating a Knowledge Graph in 12 Minutes
Takeaway 3: Organisations want to reduce 'Time to Value'
In order to get to market rapidly, and be able to iterate based on real customer needs, organisations are aiming to get their knowledge graph platforms launched faster. From inception to commercial operation, how do we do this? Whether it is for a reference implementation, or for commercial use, tools to enable rapid model building, data ingest, and ready-to-go APIs are front of mind.
This video shows how a knowledge graph with Netflix, Disney+, Amazon Prime Video and Hulu data can be built, with APIs and powerful UI, in just 13 minutes.
Watch: 13 minutes to setup the media graph
But Remember... Preparation is Key
One thing we consistently emphasise is that good preparation is essential. The speed and relative simplicity of the setup of Data Graphs is only possible with solid information preparation - data that was already clearly structured and well organised. Designing your domain model is an essential step in establishing the shape of your data before embarking on your first implementation. It will change, no doubt, but do avoid rushing in without a plan. Spend time thinking about the specifics of your data, the core entities in your domain, the key relationships between them, and this will enable you to make an effective start.