Data Graphs drinks its own Champagne
Data Graphs runs Data Graphs. Yep, along with our own Data Language and Tagmatic websites, the Data Graphs public website runs directly on top of the Data Graphs KG app - fully content managed, edited and maintained, including imagery all in the knowledge graph, rendered directly using the Data Graphs APIs and SDK, and it took just 10 working days to build.
Step 1 - Information Architecture and Visual Design
[3 days plus iterative revisions of visual design over full 10 days]
Like most website builds the first step is the same - design the user experience. What are the key messages and user journeys we want to land? What information architecture do we need to deliver this UX and deliver great SEO?
For a SaaS product website there is a typical pattern to follow. We needed web pages to express the core product features, a customer list, key use-cases, a pricing page where users can sign up, and a Contact Us page. No surprises here really - along with Terms and Conditions and Privacy pages typically linked in the footer. But we also wanted the ability to editorially create landing pages on the fly for SEO and marketing purposes and also do product comparisons - all user driven without having to deploy / change code. This is where a Content Graph based approach really excels: flexibility and evolvability.
Step 2 - Create a Content Graph domain model
[1 day elapsed, plus small evolutionary changes over 10 days]
Create a new Data Graphs project and construct a domain model directly within it.
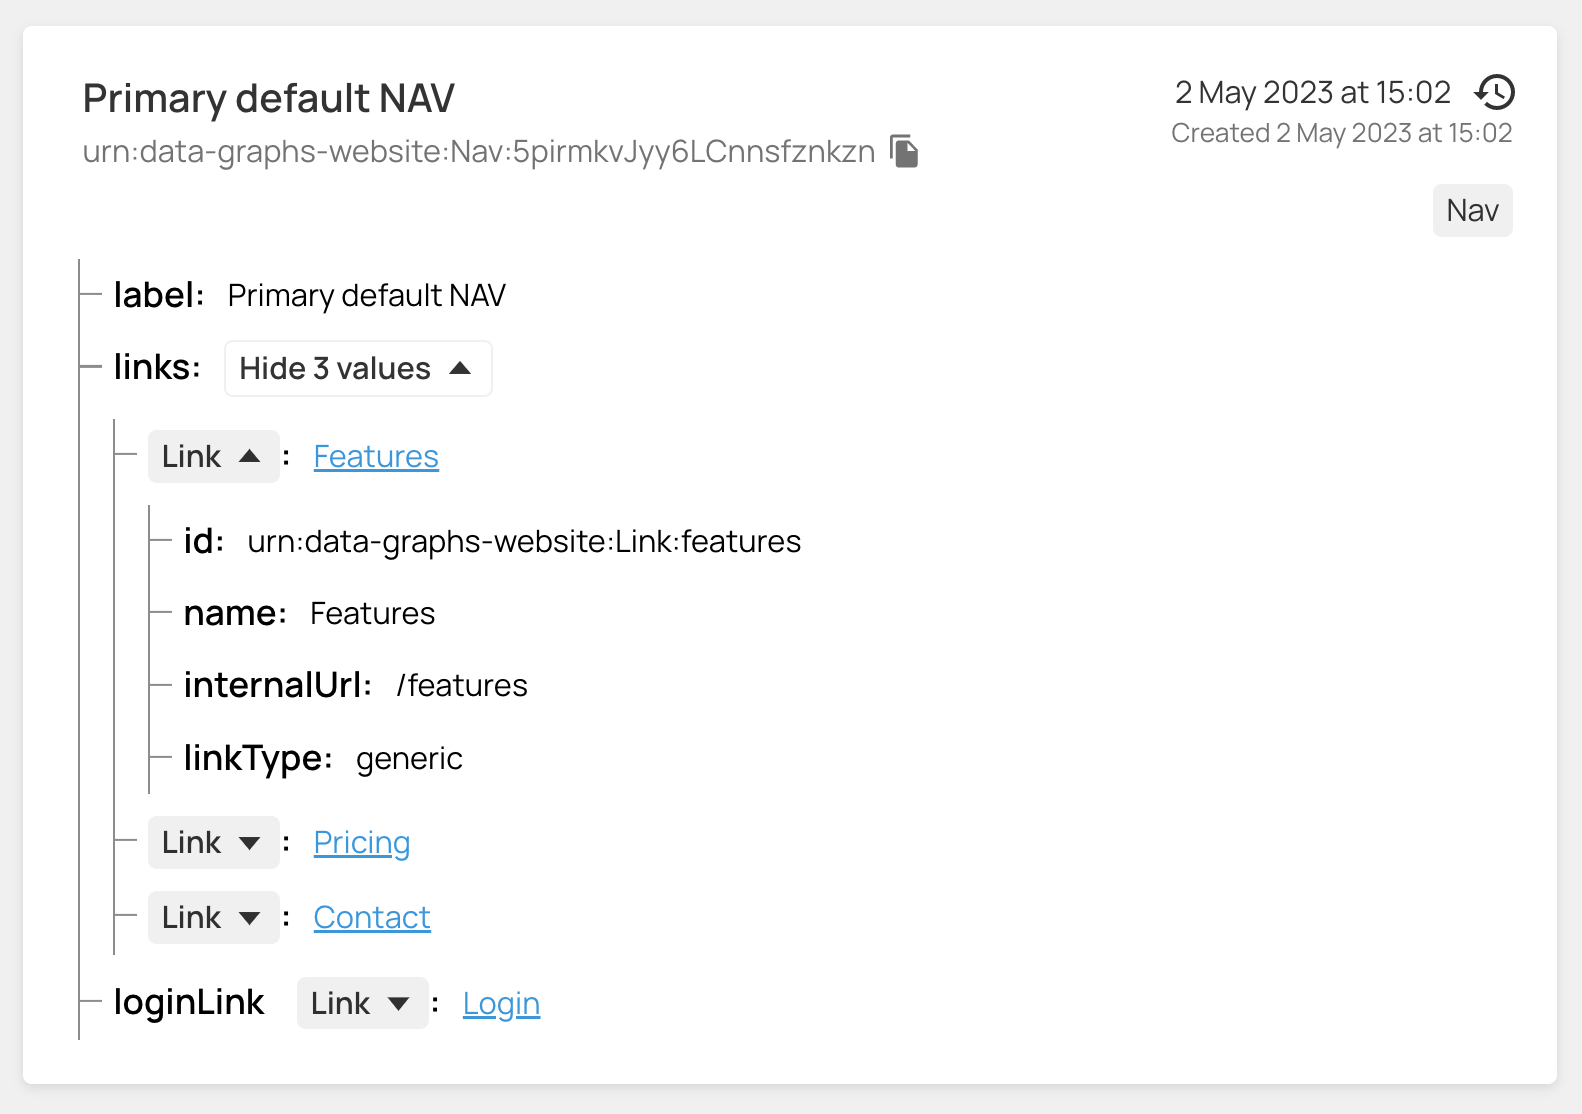
First we designed a content graph model that allowed us to implement the CMS components to drive the site structure. Literally a Site class, with Nav, Footer and Links, and WebPage classes. This would allow us to dynamically create new pages directly in the graph, with data driven links, and editorially choose to include them in the Nav or Footer. Specialist pages (that might need a unique UX) would be a sub-class of WebPage: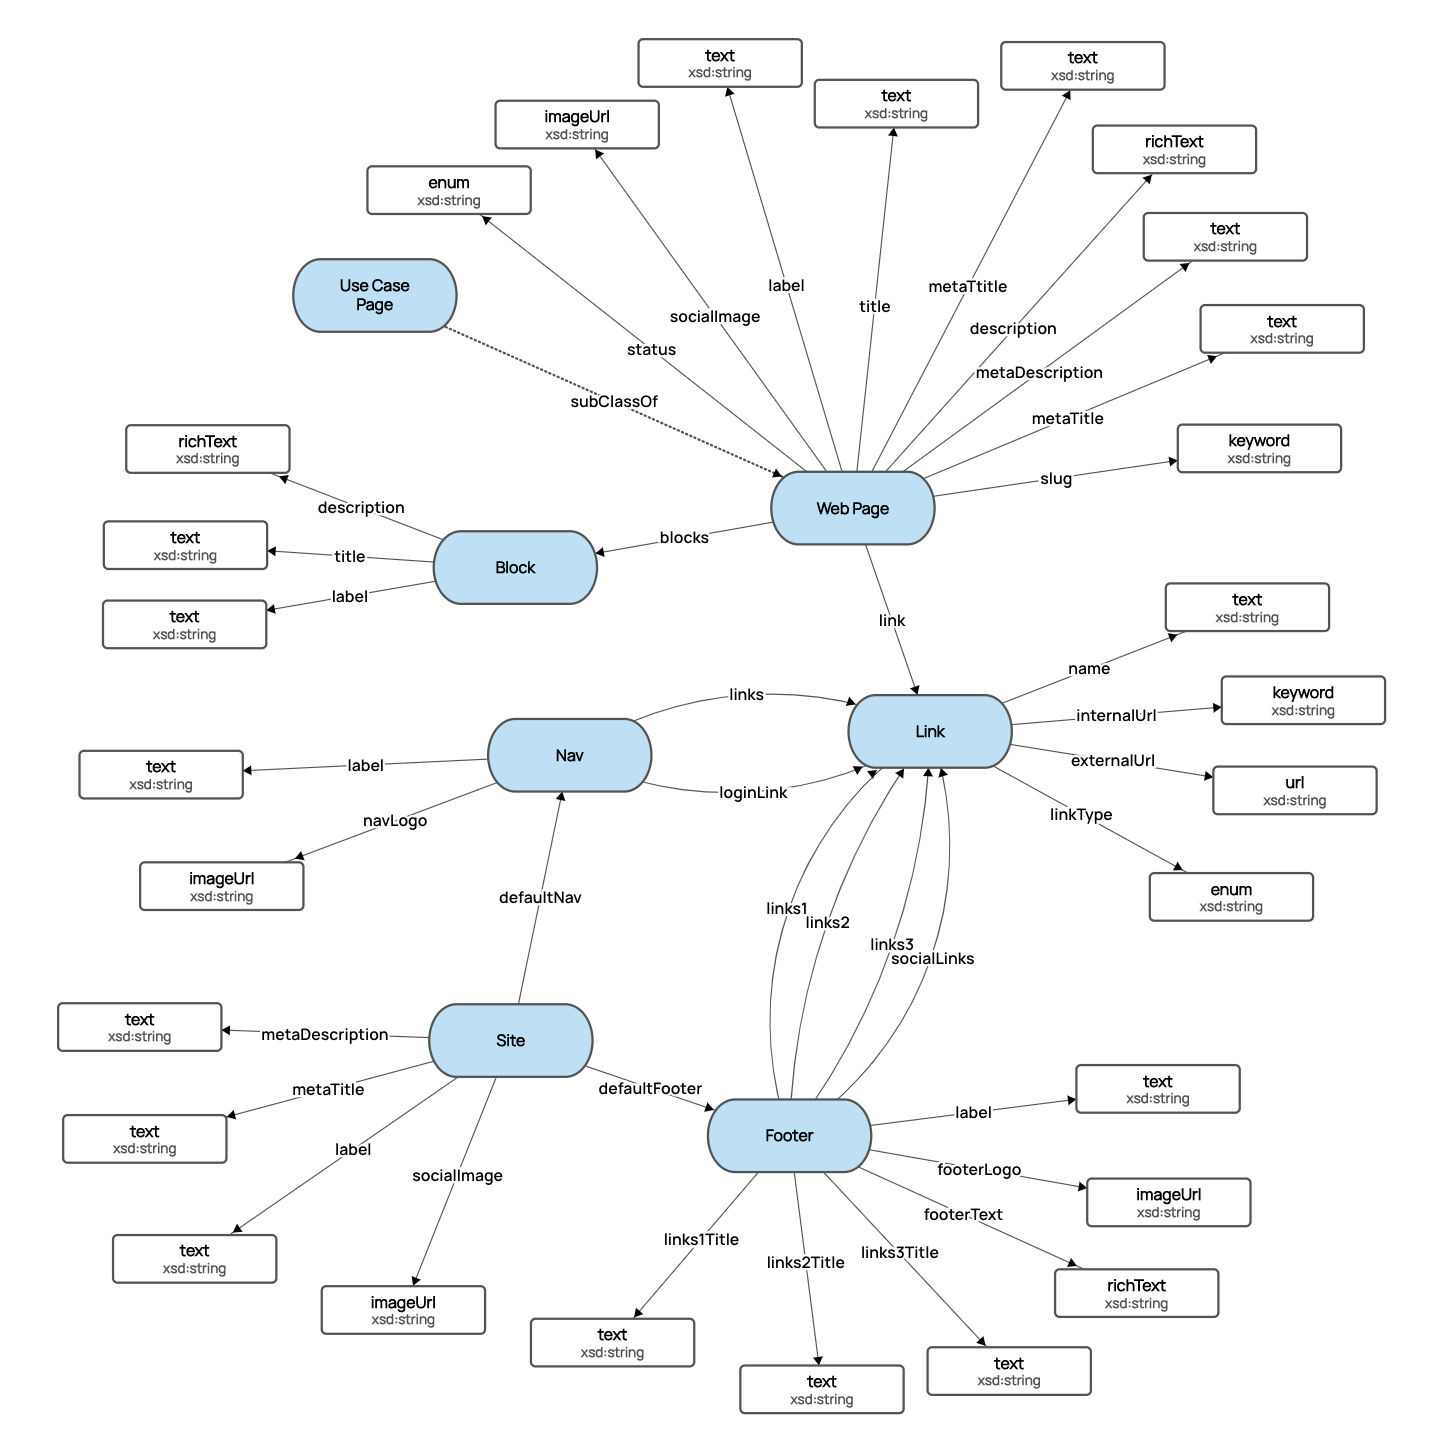
The second part of the content graph we needed was a simple model for domain entities for Organizations (customers), Pricing plans, and Use Cases: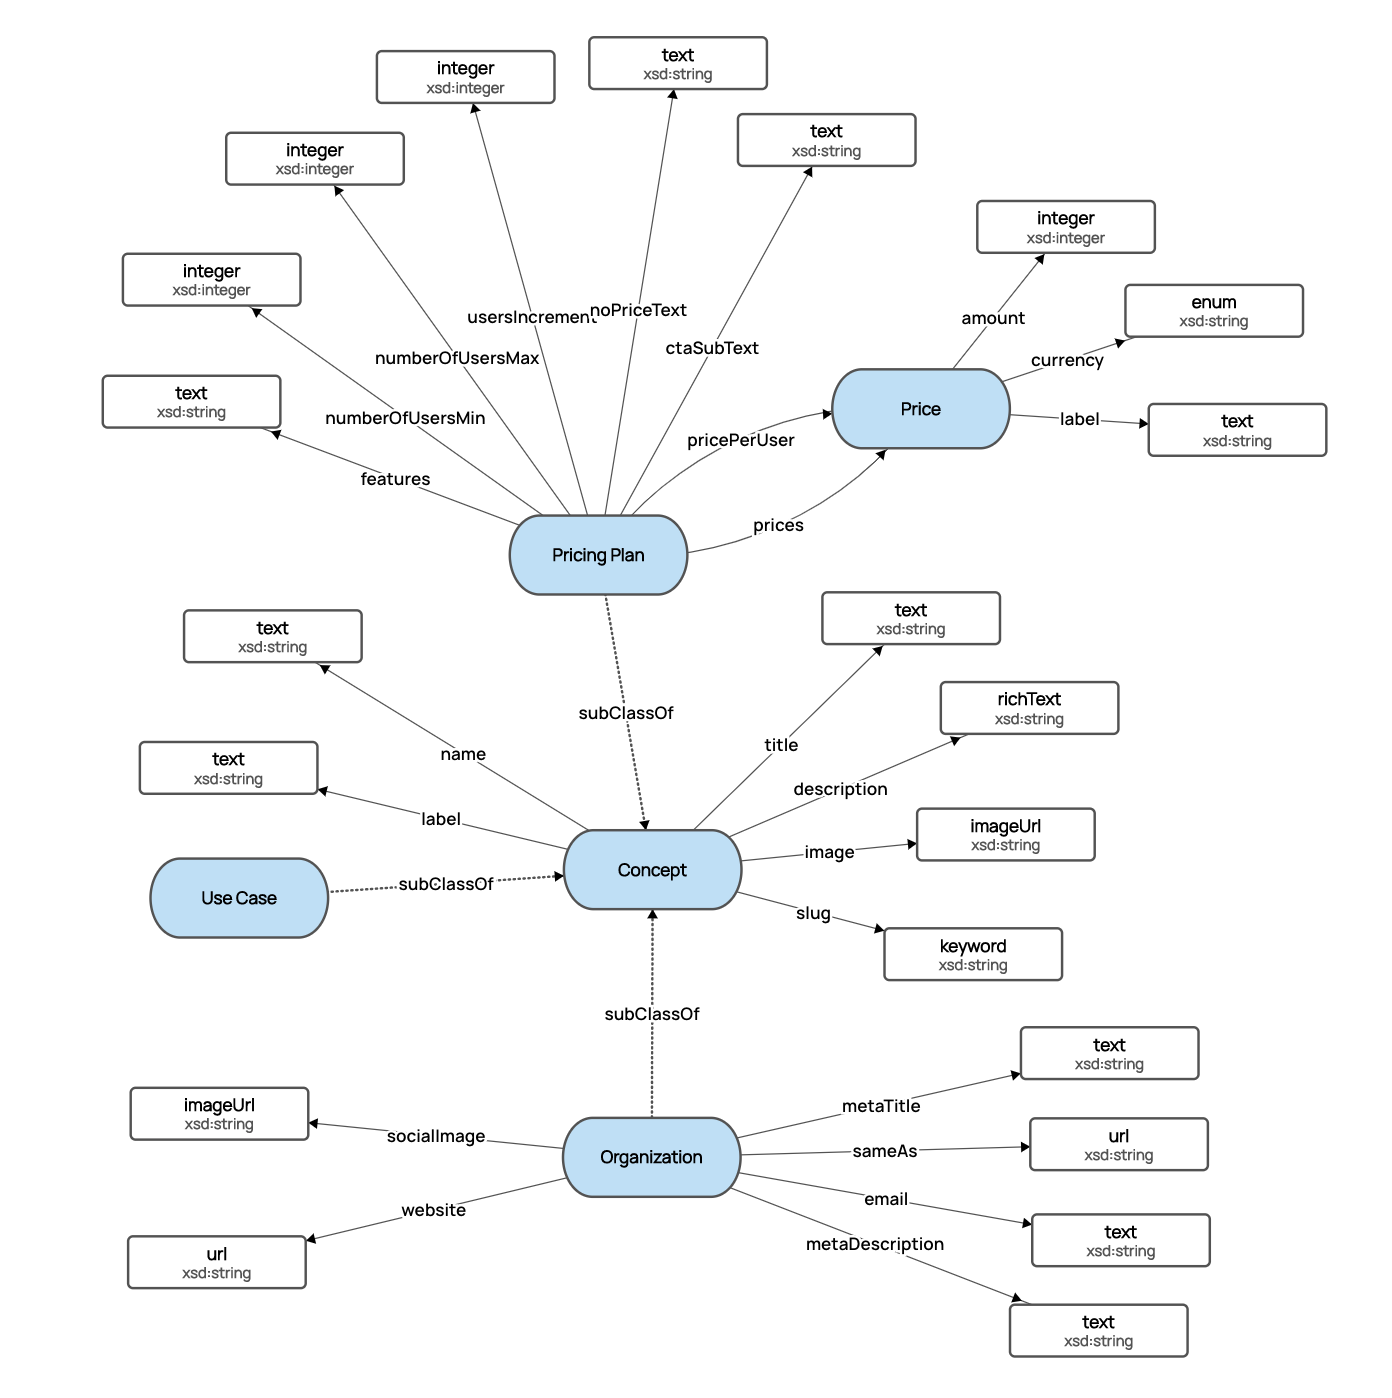
Finally we needed to model component parts of web pages. We called these Blocks and created specializations (sub-classes) of Block such as HeroBlocks, ImageCarouselBlocks, FeatureBlocks, or FormBlocks that could be used to implement the UX design. In the first diagram there is a property of the WebPage class called `blocks` to hold an ordered collection of these Block instances: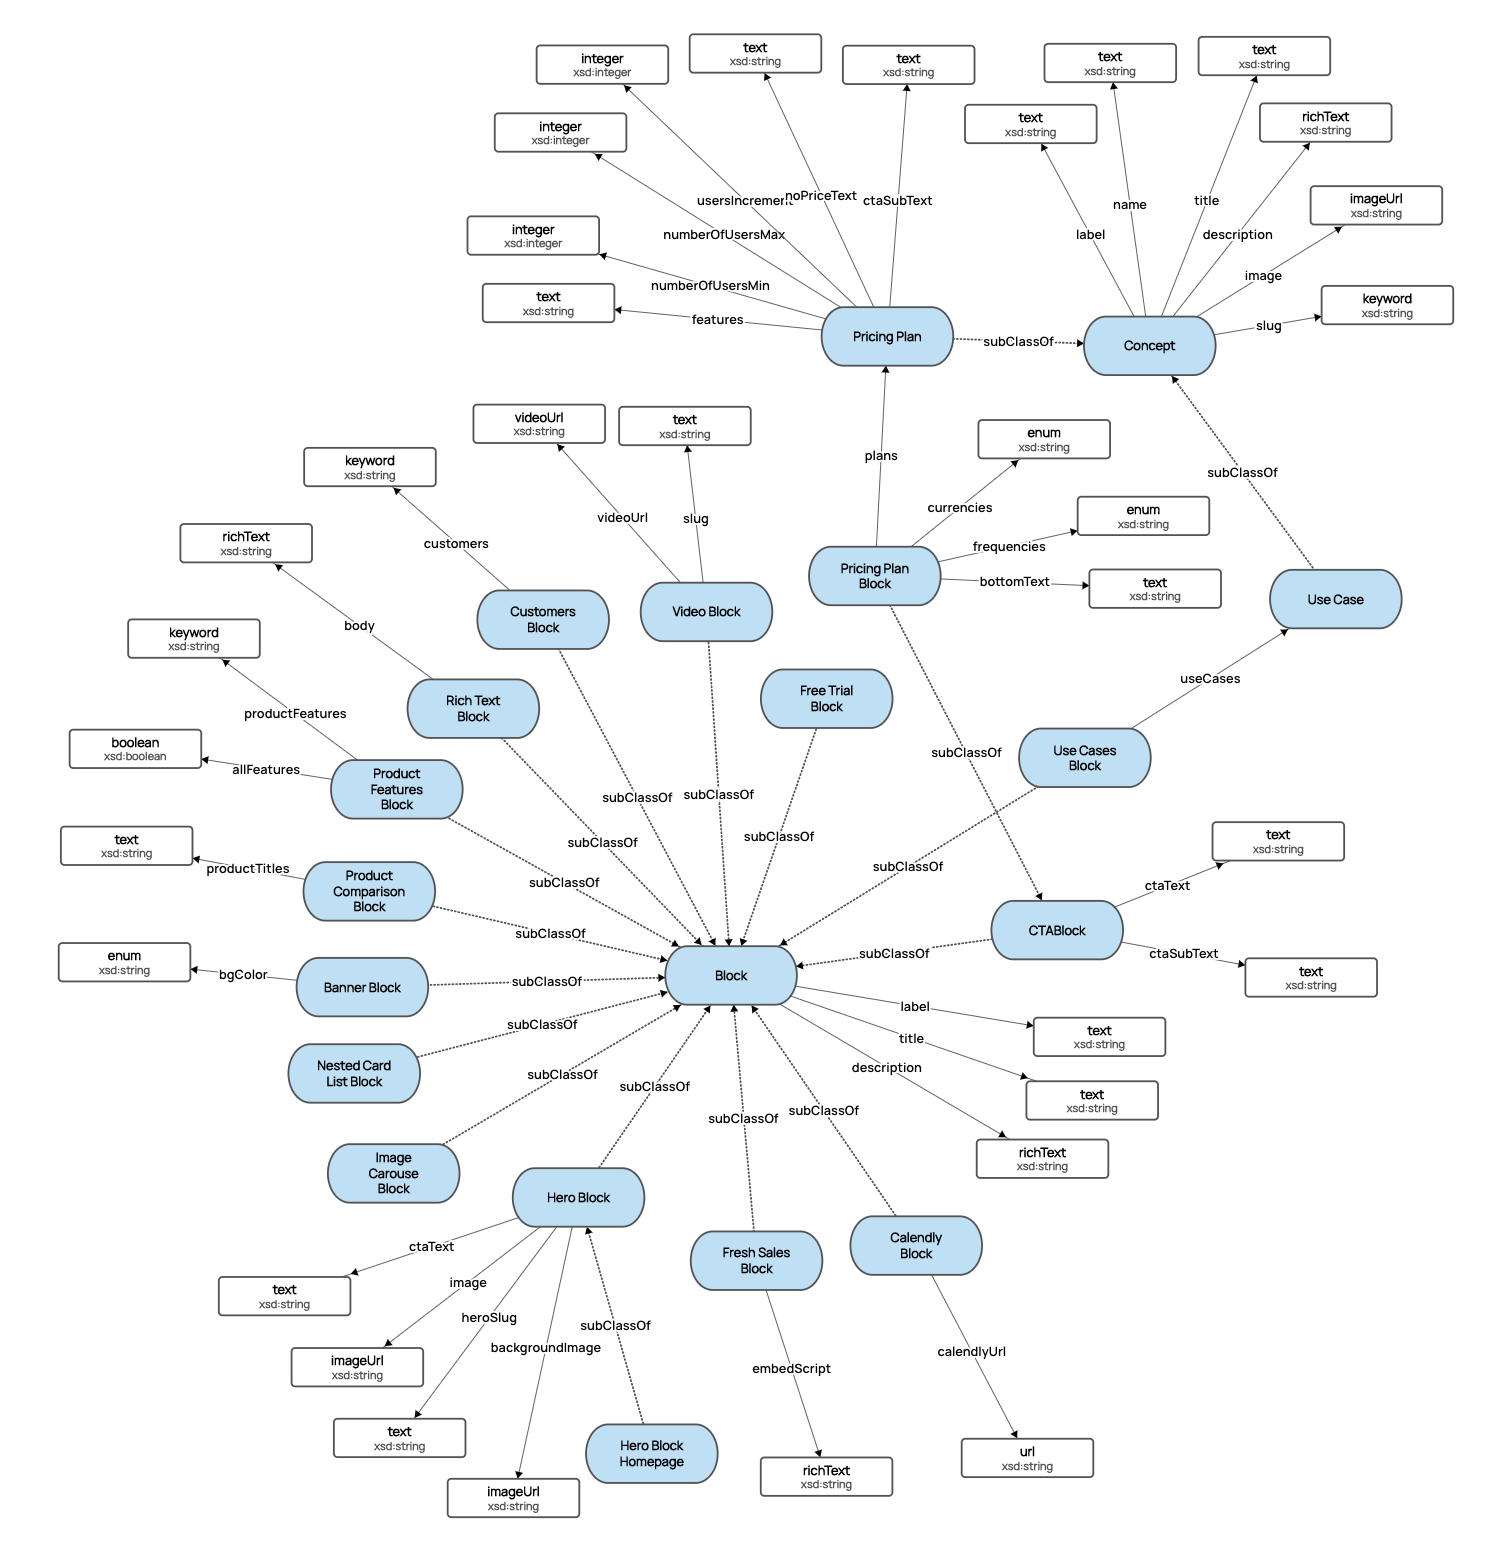
Ultimately, every single bit of copy including images, meta titles, and meta descriptions on the Data Graphs website could be created, edited or modified directly in the knowledge graph.
Step 3 - Create data for the site structure
[Just 20 mins]
Create Datasets in Data Graphs for the Site, Links, Nav and Footer adding the classes from the model into the Datasets and then creating data for the basic site structure. The navigation bar, logo, and the footer on the datagraphs.com site are rendered directly from this data: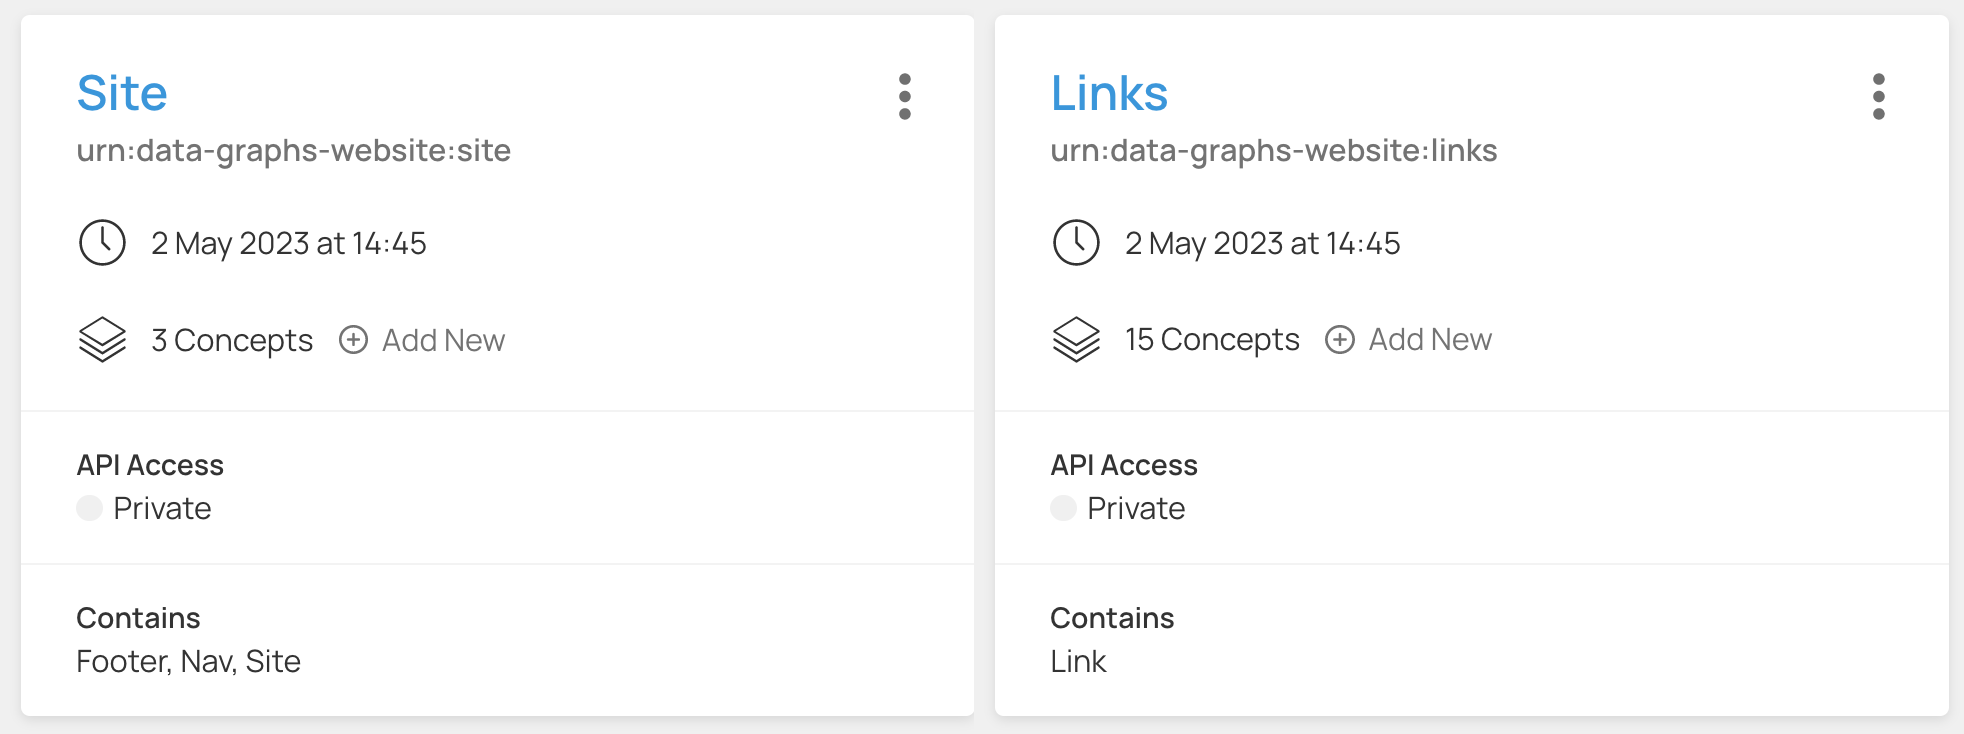
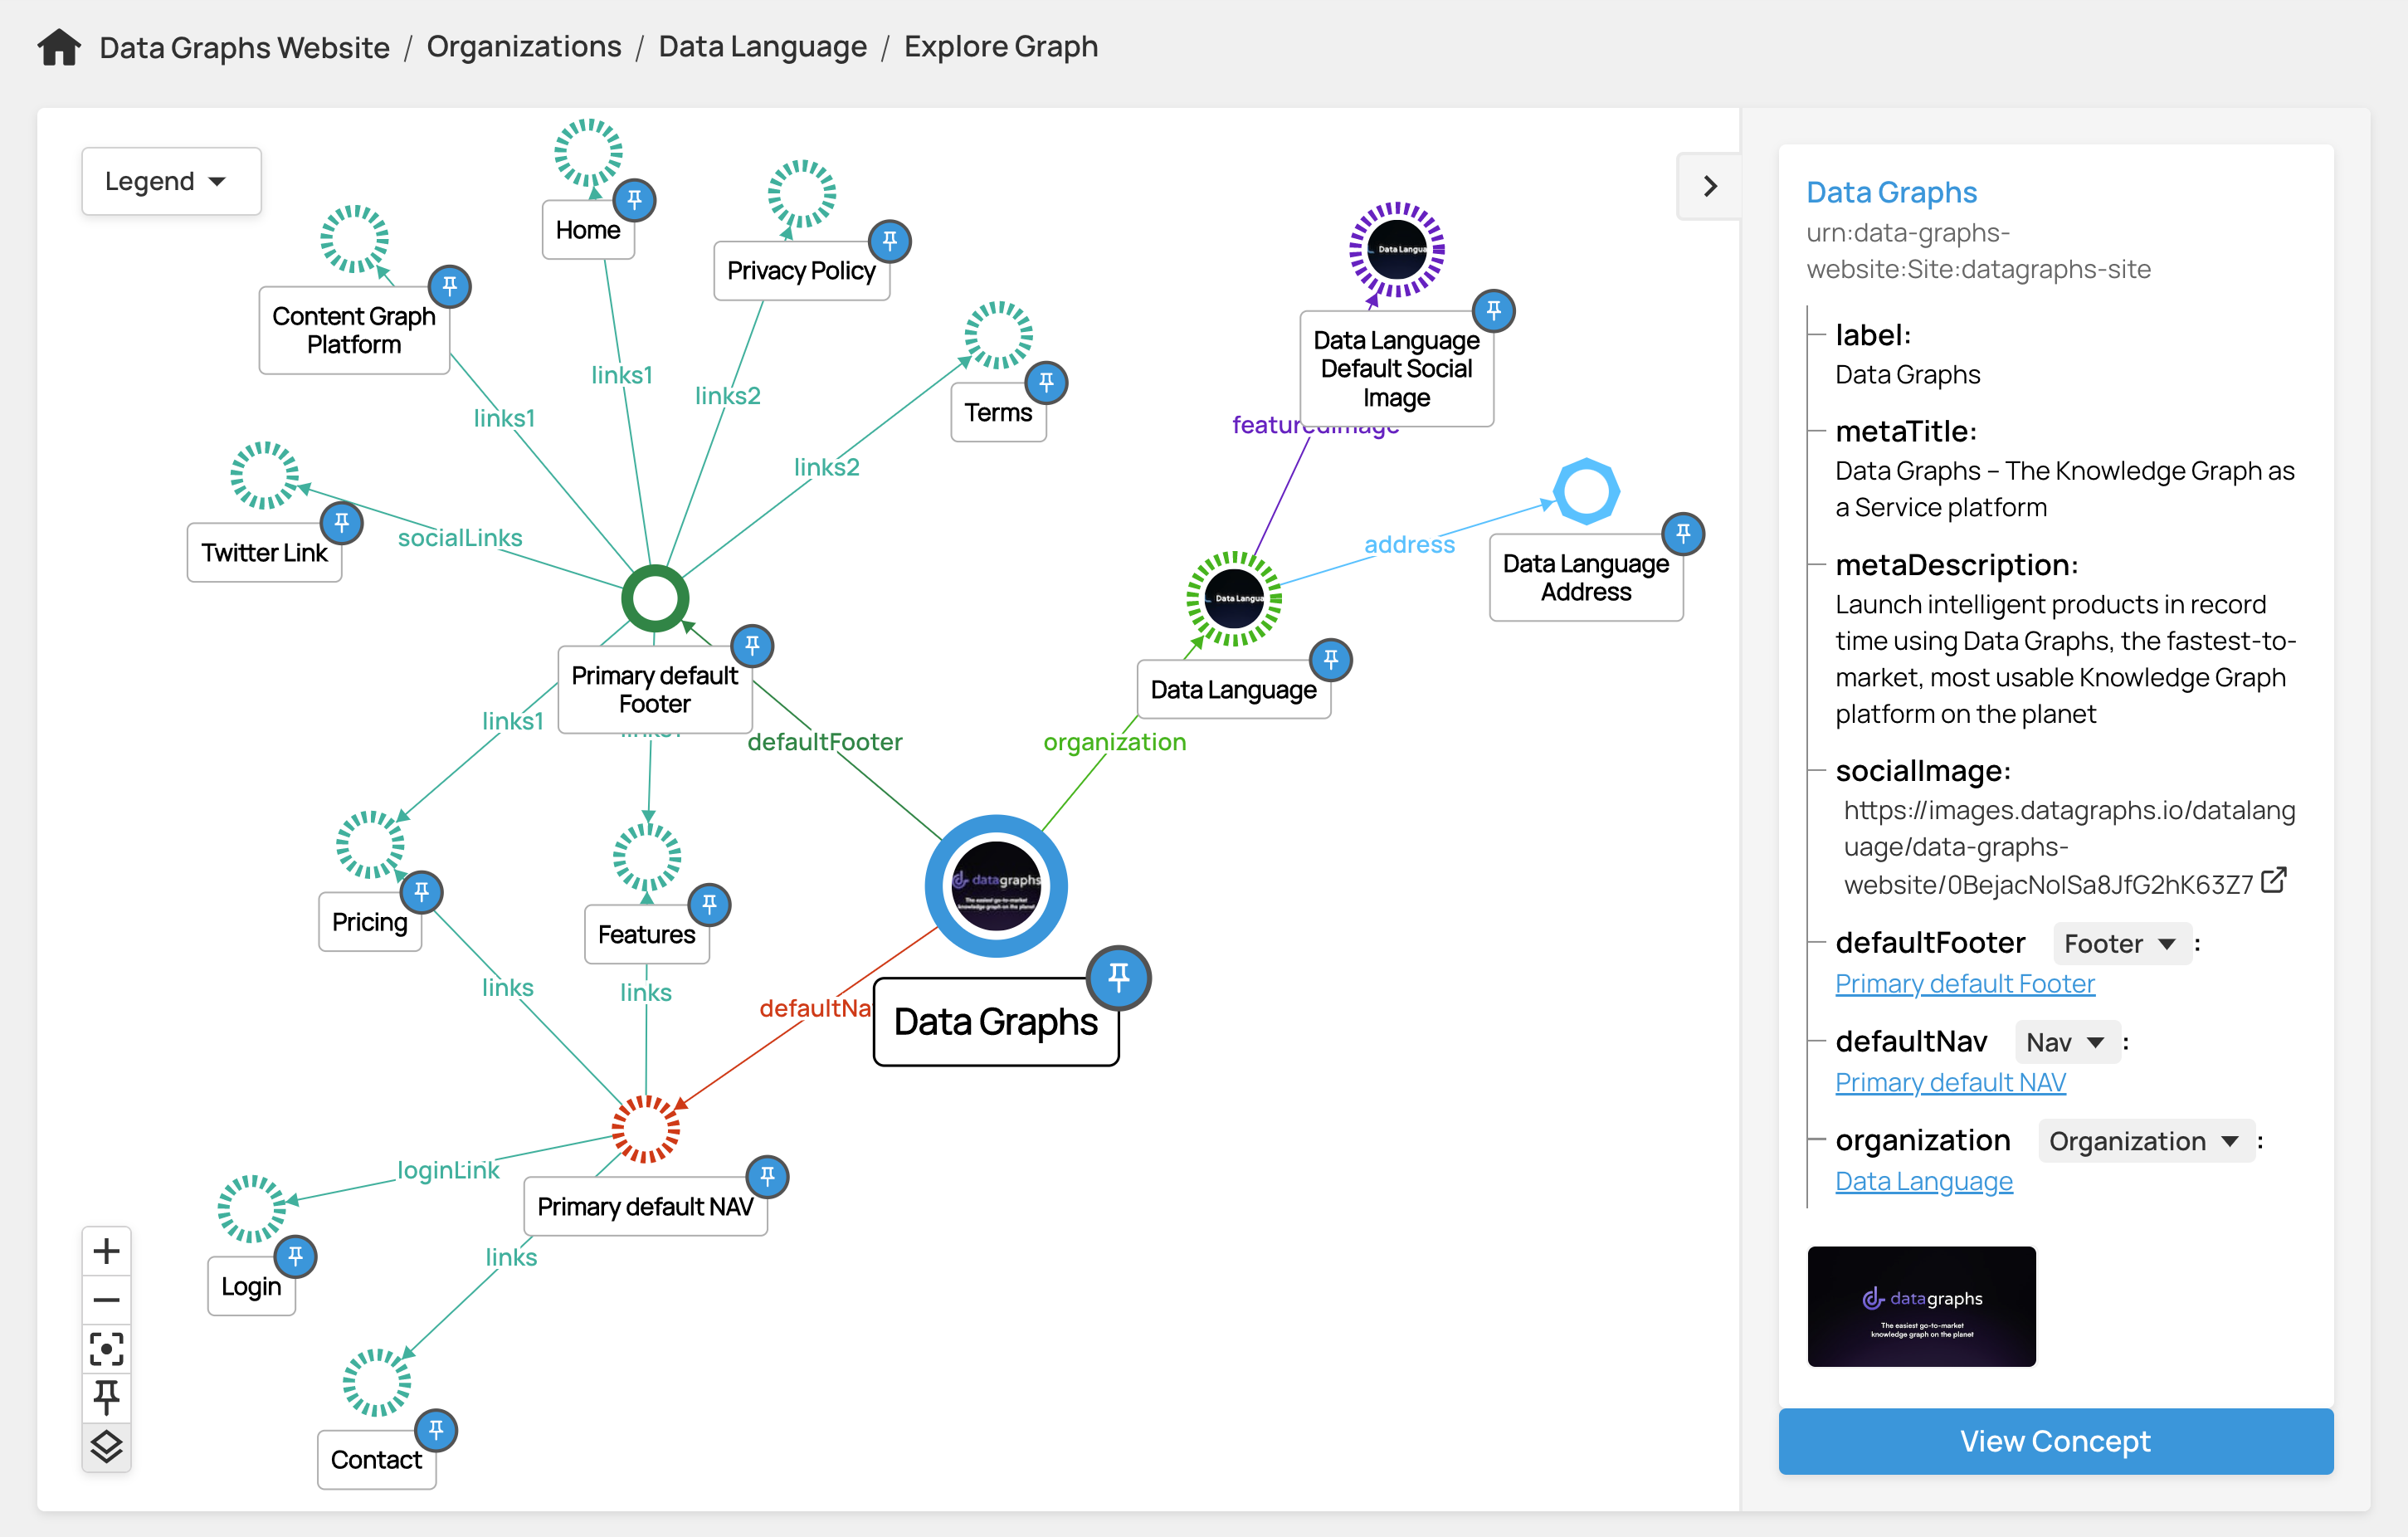
Step 4 - Create data for the main web pages
[2 days elapsed, and minor ongoing copy tweaks]
Create a Dataset in Data Graphs for the WebPage classes and populate with content. You can see 4 blocks were created and added for the 4 main sections of the home page here: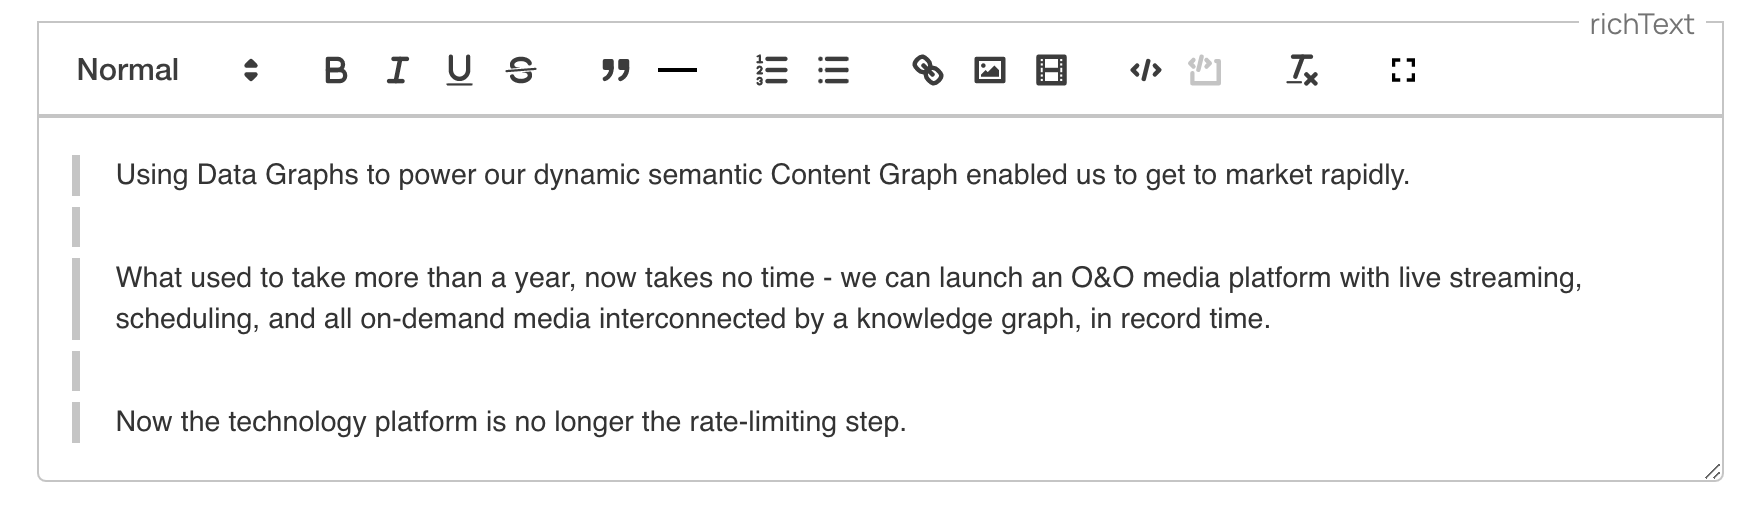
Note the `status` property on each WebPage - this is defined as an enum datatype in the graph with values of Draft, Preview, Published, and Withdrawn. This allows us to pre-create pages for the site without them being publicly available until the status is set to published.
RichTextBlocks and block descriptions on pages have their own unique datatype in Data Graphs, and the content graph editor handles these properties with a suitable rich text editor:
Step 5 - Build a ReactJS app for the site
[10 days elapsed time to build the app - 1 react developer]
We started this on day 1, and used ReactJS and Remix. Remix was set up to load data directly from the Data Graphs APIs server-side using the JS SDK using an API Key and read-only client credentials configured in project settings of the app.
- The Site, Nav, Footer and Links JSON is loaded into state. React Components for the navigation header and footer are bound directly to the Nav and Footer JSON objects read from the graph.
- The WebPage instances are loaded, and for each Link a dynamic request route is generated.
- Each request is then routed to a page renderer that uses the individual WebPage JSON-LD object instance for that route.
- The WebPage is then rendered with the default Nav and Footer components, and each of the blocks in the WebPage is rendered using a component dynamically loaded based on the Block sub-class type in the content graph model, and styled to match the visual design, for example the UseCaseBlock is rendered with a matching UseCaseBlock react component, pulling the block title, the image and the copy from the graph API:

With this pattern in place, the entire datagraphs.com website is dynamically driven from the content graph. If we need a new landing page, we can simply:
- Add a new Link concept in the graph using the Data Graphs UI . This defines the Link name for the page, the slug which is then automatically routed in the Remix app.
- Add a new WebPage instance using the Link just defined, and populate with appropriate metadata, copy, images (uploaded directly into the content graph) and blocks.
- Use the status property on the web page instance in draft/preview mode until we are happy to set it live.
- If we want the new page to appear in the Nav bar, we can simply add its Link into the Nav concept in the graph:
Step 6 - SEO
[2 days]
In our graph model each WebPage instance is responsible for its own SEO metadata. There are properties defined in the WebPage parent class for metaTitle, metaDescription and socialImage. Each of these properties is used to generate the meta-tags, twitter cards and open-graph (og) entities in the HTML page header.
We then also generate schema.org JSON-LD for each page depending on the type and content of the WebPage instance. For example on the pricing page, the WebPage links to the PricingPlan from the domain model for the Data Graphs product. This allows us to both dynamically render the pricing plan on the site, and also populate schema.org for a google Product rich snippet from the graph instance data. To update the pricing plan, we simply update the data in the content graph. This then also modifies the SEO rich snippet, everything is in-sync, all sourced from the same place in the graph: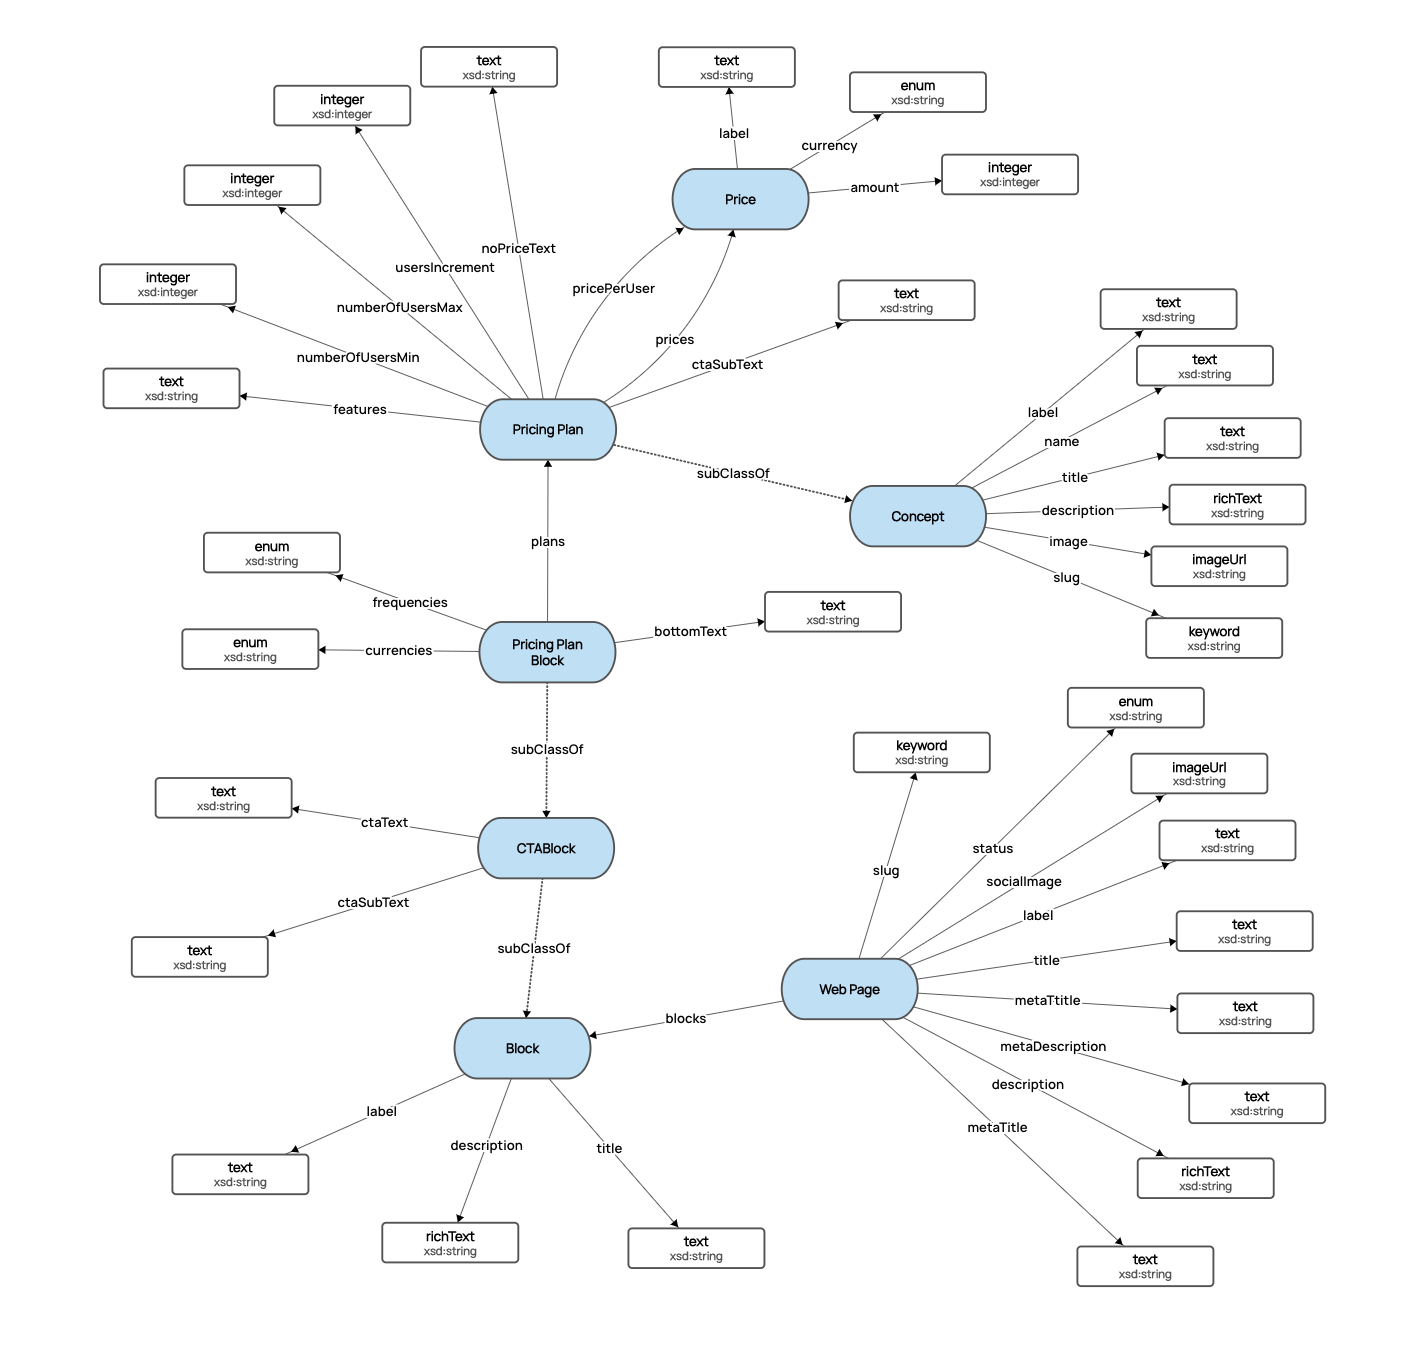
Step 7 - Deploy the App with Fly.io
[3 hours]
We are hosting our websites on fly.io This is a superb platform for deploying NodeJS apps onto, and supports remix apps out of the box. As well as being outstanding value it is much simpler than using one of the big cloud providers, and deployments can be setup in just minutes. We deploy a DEV and a LIVE version of our app and use a bitbucket pipeline to automate deployments when code is PR’d and merged.
We have our remix app configured such that in DEV if any of the pages or creative works in the graph have the status preview we can see them rendered on the dev instance of the site, but only when the status is changed to Published in the graph does the page appear on the Live public deployment.
Pop the cork! - the end result
A brand new datagraphs.com website, fully content driven from the Data Graphs app all done in 10 days in a furiously busy two weeks leading up to the 2023 Knowledge Graph conference in NYC!
The Data Graphs site really does drink its own champagne, perfectly demonstrating how easy it is to build a content graph, and use it for a practical application.
The flexible model of knowledge graphs is an agile developer’s dream, allowing you to evolve the model and data rapidly and easily as your project evolves. With a traditional CMS you are typically coupled to and constrained by a quite rigid relational data model based purely around posts, so building extensions and custom components and integrations can be hard work and not developer friendly. With a Content Graph based CMS, the model can be evolved on the fly to meet any feature requirement you need, with a well modelled data structure that you can define, and APIs that return JSON that aligns with your domain model, not data coerced into "posts".
If you would like to try Data Graphs for one of your own projects, get in touch!