Data Graphs - Fully Managed Knowledge Graphs
Data Graphs is the latest Data Language baby. Data Graphs was born out of need, a need for really easy structured data management. Our thoughts on this evolved to eventually produce a SaaS product that allows a team to curate a knowledge graph for any domain, from simple flat concept collections to complex structured domain data. This is all wrapped up in an extremely intuitive user experience, combined with a fully comprehensive API and web-hooks to give you extremely efficient integration with applications and business systems. You can check it out here : https://datagraphs.com
What does it do ?
Put simply it provides a dead simple way to create knowledge graph data models, populate them with data, and interrogate (query) and integrate that data with your applications using a flexible and easy API. In essense, it is Knowledege Graphs as a Service (KGaaS).
Building your own knowledge graph platform can take months, requites highly specialised expertise and lot of $$, and that is before you start populating it with data. Even when you build your own KG platform, the information management tools dont come for free, and are typically sorely lacking in utlity.
We have short-circuited that complex engineering process, and done all the hard yards for you. Futhermore we have added a stunning information management user experience. With Data Graphs you can be up and running in minutes, start creating your graph data models, and managing your data.
You don’t have to worry about scaling, engineering, backups, it’s all handled for you. But best of all is the super-intuitive user interface for managing, searching, and maintaining data over time. The API lets you search, query, filter, and facet on your data - slice and dice it. The API is rocket fast and easy to use, and also geospatially aware.
We think Data Graphs addresses a lot of use-cases, from straight-forward data catalogs or vocabulary management, to easy to setup and maintain knowledge graphs. You could use it for managing structured tagging data for a publishing system, integrating it with your CMS, or even for maintaining time series structured data powering charts in WordPress for data journalism. It is ideal as a central metadata or reference data repository for your enterprise business systems. You could even use it for maintaining a nicely categorised and faceted product catalog to integrate with your e-commerce store.
Schemas, Concepts, and Datasets
The Data Graphs model is based around three fundamental ideas -
Datasets - these are collections of Concepts - organised into groupings of your choice. Datasets can hold concepts of different types, or concepts all of the same type. Datasets can also be public or private -
- a public dataset means the data it holds is accessible via API using only an API key, so it could be directly accessible via anyone on the internet, who has access to your API key.
- a private dataset means the data it holds can only be accessed using Open ID / oAuth security credentials
Schemas - this is your data model, definitions of the things (or concepts) in your domain, their properties, and how they are linked together, the relationships between the things. Data Graphs has an intuitive user interface that lets you quickly design a data structure that reflects your own domain model. Each Concept type in your domain has its own schema definition where you define the properties of a concept and the data types of those properties (dates, integers, text etc). For example, a simple schema of a Person might have a givenName (text), familyName (text), and a dateOfBirth (date), and a headShot (image). Rather than explain it in depth here, if you need to know more, we have made a short video that shows how quickly you can create a schema for your domain model.
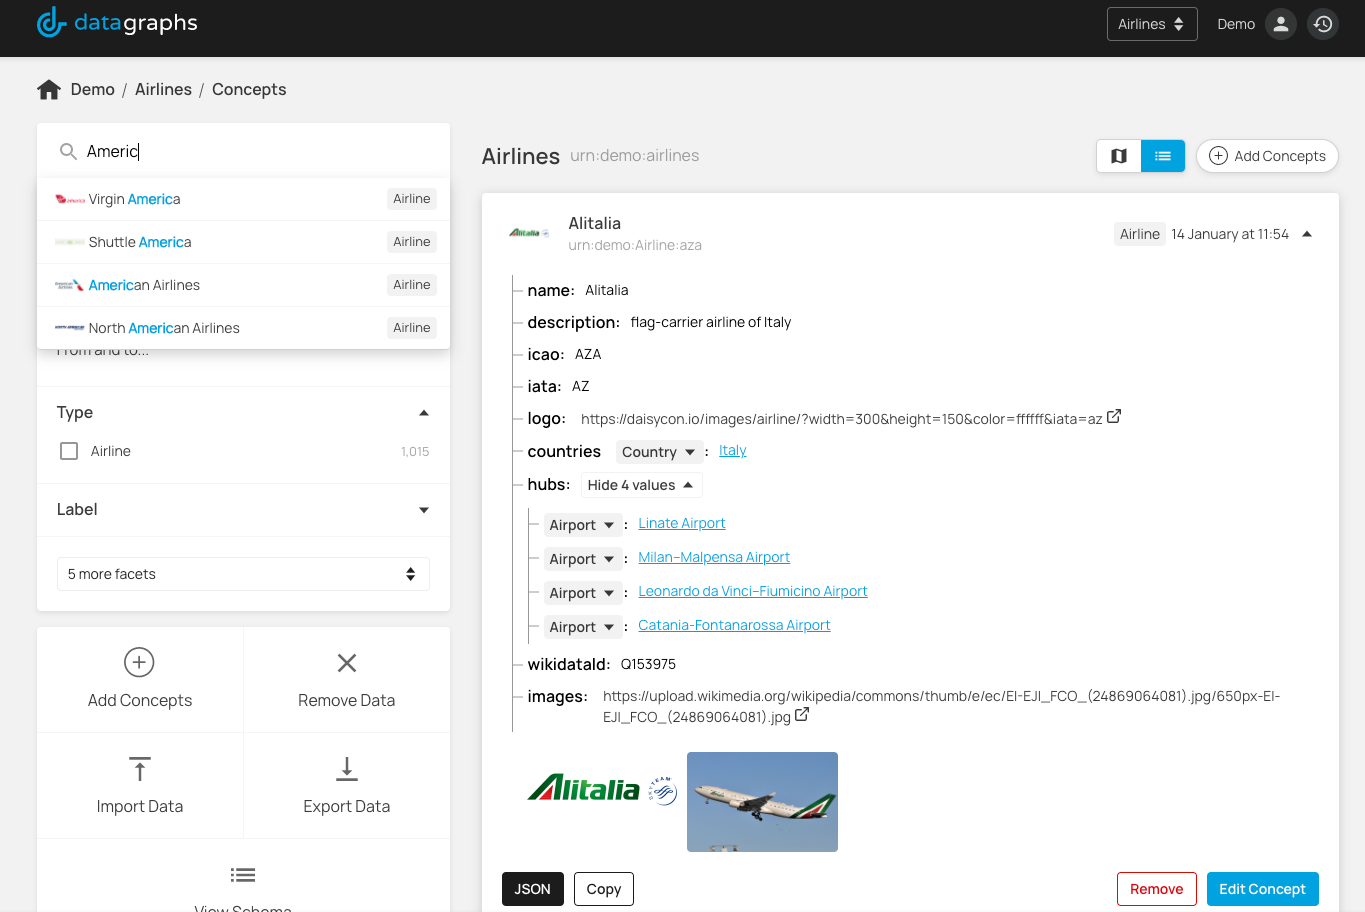
Concepts - the data itself. Concepts are the data instances that you load into Data Graphs conforming to your schemas. You can create and edit concepts via the user interface, bulk import them from for example CSV files or external sources, or load them via the Data Graphs UI. Once created, you can search , discover, and maintain the data via the UI.
SaaSification
Data Graphs is fully SaaSified - you can sign up online, frictionless, and get started immediately with a free trial. You can manage your own users, roles, your own backups, your own API keys and oAuth credentials.
The User Experience
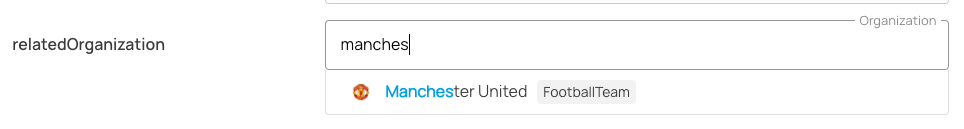
Delivering a great data management experience was our primary goal when creating Data Graphs. In almost all the knowledge graph and information management projects we have worked on, data management and curation tooling was always an area that was a challenge. We set out to build something extremely intuitive to use, with a UI that would be self-aware of the data types, the relationship semantics, and make it super easy for users to explore, find, and navigate data.
Dog Food
We are great fans of the “Eat your own dog food” approach to product development. If our APIs are not good enough for ourselves to build an application upon, how can we expect them to be good enough for others? With this in mind, all the features in the Data Graphs Application are built upon the same APIs exposed to the Data Graphs client, and with that in mind, let’s talk about integration..
Integration
There is no point having a fabulous user experience for ingesting and managing your data if you cannot integrate it. As with most SaaS products Data Graphs comes with an API. A set of REST endpoints for searching, filtering, querying, faceting, retrieving and creating data. It is fast, it is flexible.
With the API you can access data only in specified datasets, or you can federate a query across all your data.
If used with only your API key, you access only the data in public dataset. If used with your oAuth credentials, you can access both public or private datasets.
Web Hooks - Triggered
The API gives us pull integration, web hooks provide us with push. You can configure web hooks for Concept create, update, delete, and also candidate (concept) approval. You define optional endpoints (typically in your own platform) that are invoked whenever a specified Data Graphs event is triggered. For example you could trigger some downstream system when a Concept of a specific type is created or updated. For example if an Organization concept is updated, trigger some workflow in an existing business system. The web-hook events supply the entire concept data in its payload, which means you could use this to push data into another database or application.
Querying data - The Data Graphs Filter Expression Language
As well as features such as sort and facet (by concept property) the API lets you query your data using a flexible filter expression language (often called NQL). In simple terms, this lets us filter data like this filter=property1:value1,property2:value2
A filter expression is a string which provides a (Concept) property, operator and value in the form where property is a JSON path representing the field to filter on (using JSON dot notation) and operator is optional , and tells the API how to compare values. value is the value to match against.
Operators can be -(not), >, >=, < <=, and also a test if a value is in a group of values [value,value,...]
Boolean expressions are also supported including parentheses for grouping expressions together, and overriding operator precedence.
Full text search is supported using the traditional q parameter. We index all the text fields in concepts, and boost the canonical labels.
Combining all these together lets us build extremely high utility data queries, and very flexible integrations.
You can query within a specified dataset, or you can federate across all your data, and using the filter expression language it means you can ask extremely useful questions of your data.
The API is fast - you can expect all requests to be returned in less than a few hundred milliseconds.
Geospatial
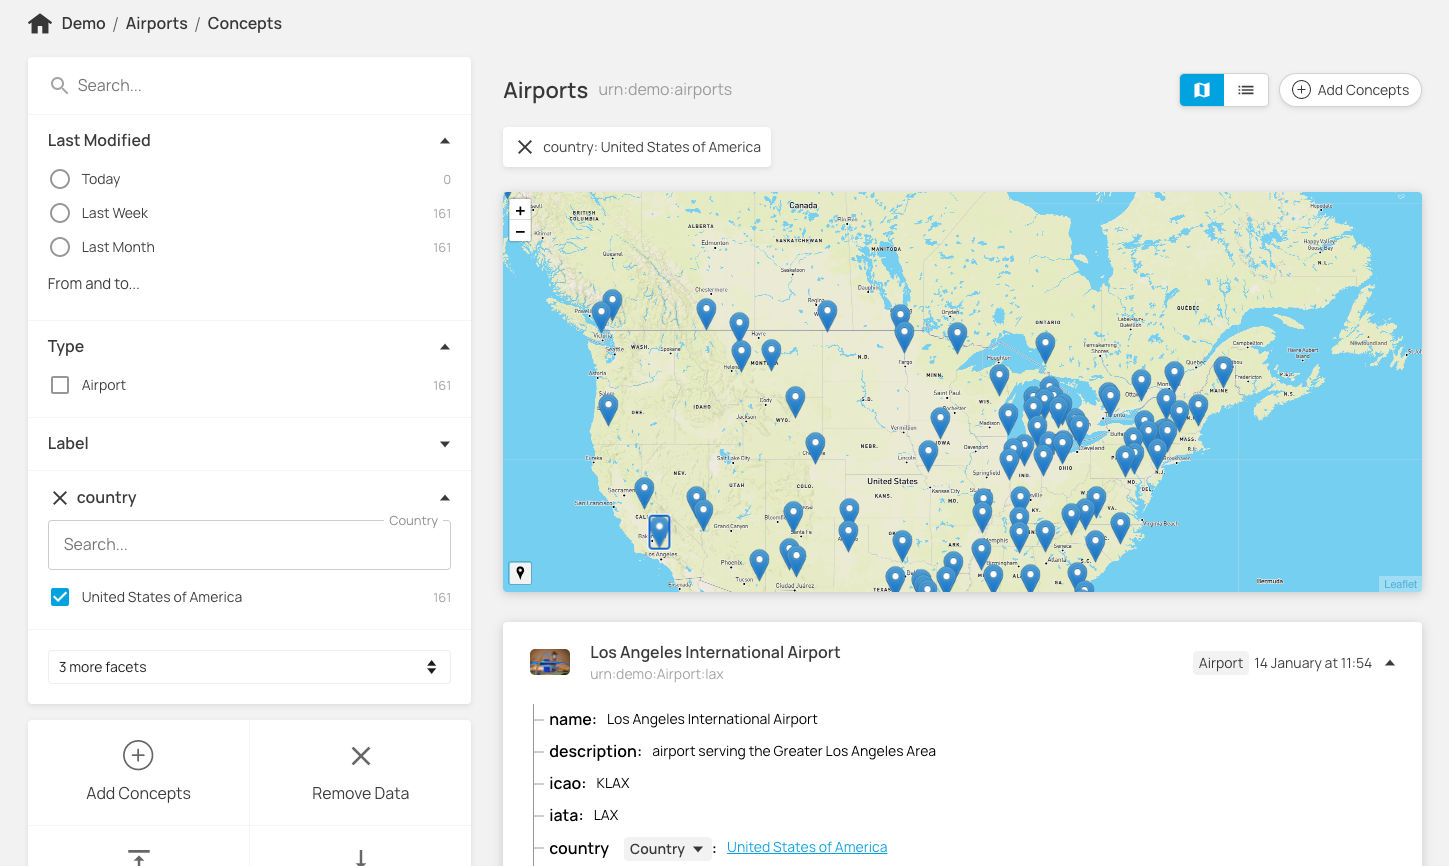
We also support geospatial data. We have primitive datatypes for latitude, longitude and geohash - so both our API and UI can be geospatially aware for concepts with location information. As well as being able to explore geospatial data in the UI on maps, you can also query geospatially using point-radius, bounding-box, and bounding -polygon queries. Any geospatial query can be combined with other API filters and full text search.
This means you can ask questions of your data such as “Find me all the concepts within 50km of New York, classified by X, with property P greater than Y, and the word “hello” in their label”. Nice.
For example, given a geospatial data set of Airports with relationship to airlines , get all airports within a 50km radius of London, serviced by EasyJet, we might use an API request like :
/airports?filter=_near((51.51, -0.12), 50km),airlines:urn:demo:airlines:easyjet
Client Library
For developers we have published a Javascript client library for Data Graphs to make integration even easier. The client library is particularly useful for consuming the API using OpenID credentials, as the machine-machine OpenID authorization flow is all taken care of. The client library documentation is published in NPM here : https://www.npmjs.com/package/@datalanguage/datagraphs-client
Sub-classing, Inheritance, and Transitive Inference
While Data Graphs is not a full blown graph database, it is a fully managed structured data solution that can be used to build a high-utility highly performant knowledge graph for your organization without having to manage any infrastructure. There are some key features in knowledge graphs that add significant value.
Subclassing and class inheritance is one of those features. In our (extensive) experience of working with graph databases, inference is a feature that is widely misunderstood. The set of potential inference rules available in the full RDF and OWL specification is considerable. However in most practical implementations of knowledge graphs (outside of academia), there are just one or two core inferences that add significant value in most business applications. Subclassing and transitivity is top of that list. Data Graphs has full support for this.
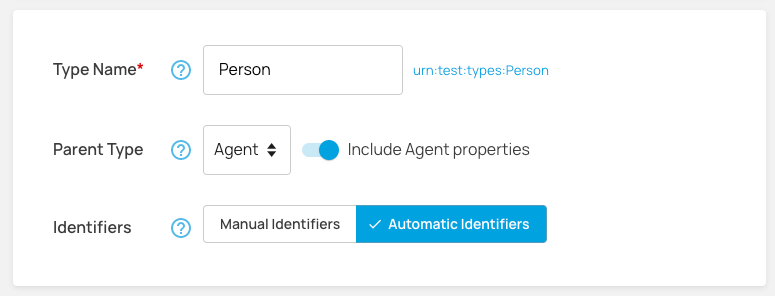
When you create a new Concept schema definition, you have the option of declaring a parent type (class) and inheriting its properties.
Once you have created your concept schemas, we have a neat class structure management tool like this :
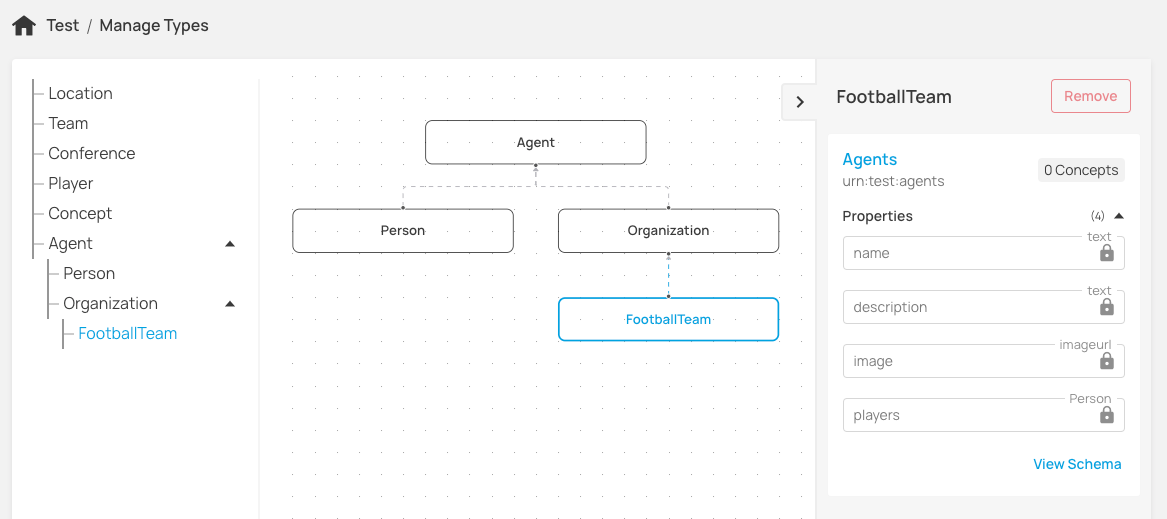
Concept relationships (and the User Experience) then become class structure aware, with transitive inference. When a concept property defines a relationship to another concept type/class the UI allows you to select concept instances of that type and all its subclasses.
API queries also obey the usual semantics of transitive inference across a class hierarchy.
Linked Data and Graph Databases
Data Graphs has support for JSON-LD. API responses can be requested with an application/ld+json mime-type such that the data is returned in JSON-LD with a context dynamically constructed from your schema.
This lets you transform data directly to RDF for loading into your own graph database, or another RDF compliant system.
So while functioning capably as a standlone fully managed knowledge graph, Data Graphs could thus also be used as a tool-suite for editing data in a downstream enterprise graph database / triple store. Using the web-hooks, it is fairly trivial to build a service that updates entities in a graph database when the web-hook is triggered from a concept create/update operation in Data Graphs.
The Road Ahead
Data Graphs already has a plethora of great features, but we have some great new ones lined up in our road map. Not least is data and model visualisation.
Building on the class structure visualisation we plan to render detailed domain model / ontology diagrams dynamically from your schema. We also plan a dynamic, navigable graph visualisation of the instance data itself. On the back-end, we plan to offer regional data storage options.
We think we have produced something really special with Data Graphs, something that really delivers utility and value for information management in your organisation - but don’t take my word for it, go ahead try it out for free.