Content Graphs: The Box Set
Season 1
Since around 2020 Content Graphs have been a hot topic in digital publishing; Knowledge Graphs tailored for publishers to describe, and classify their content semantically. While the term Content Graph may only have surfaced around 2020, you could argue that Content Graphs were actually the driving force behind the practical rise of Graph Database adoption. Our own company was formed out of the seminal (but well trodden) work our founders did at the BBC on their own Knowledge Graph platform for the 2012 Olympics. The BBC and IPTC have published ontologies for over a decade describing Creative Works and Programmes and Schema.org is another well known example of a Content Graph framework.
Knowledge Graphs however are evolving and the new generation of content graphs are already here, demonstrated through two recent case studies.
Season 2
Recap (skip if you already know): To some extent the complexity, high costs and poor tooling in the world of graph databases historically has held back the adoption of knowledge graphs and content graphs. The dream of building your own knowledge graph can easily turn into a horror movie, a mess of data chaos, and one with a blown out budget and poor viewing figures, delivering little value for your producers, but we think this is set to change. The new generation of SaaS based knowledge graph platforms with great tooling and UX deliver rapid time-to-value and drastically lower total cost of ownership.
The new generation takes Content Graphs to the next level: Graph CMS and Graph DAM where the content and media are stored in a knowledge graph as equal peers alongside their metadata, where content and data work together as a complete linked-media platform.
I am going to describe two recent case studies where our own Knowledge Graph platform, Data Graphs, was used in record time to launch two new media companies: Resolute Square and Manhattan Sideways. Both used Data Graphs as their entire back-end and editorial user interface; for their publishing data and content model, their CMS, their DAM, and their content APIs and services.
This demonstrates a new paradigm in digital publishing, where everything is data, everything is connected, and how the amazing features of Data Graphs have enabled rapid, flexible, and robust delivery of modern, exciting media experiences, where data and analytics drive user journeys, and journalists just do what they do best - creating content.
The Cast
Resolute Square
Resolute Square (resolutesquare.com) is a media organization founded by the people behind the Lincoln Project, planted firmly in the center ground of US politics with a mission to counter the extremes of US political discourse, and to uphold both democracy and individual liberty. The Lincoln Project was a hugely successful SuperPAC during the last presidential election, and the key people produce widely followed podcasts and have multi-million social followings.
Following a demonstration to stakeholders of Data Graphs being used at the UK House of Commons library for the search and navigation of Hansard, Data Graphs was chosen as a delivery platform for Resolute Square.
Manhattan Sideways
Manhattan Sideways (sideways.nyc) is the premier guide to the hidden gems of New York’s side streets. Sideways celebrates the small business entrepreneurs of the Big Apple and highlights the best of the restaurants, cafes, bars and shops through local knowledge. Sideways were looking to re-platform their best-in-class data and knowledge base, and deliver a new user experience in record time by choosing Data Graphs as their information backbone and Graph CMS.
Directed By Data Graphs
Why did these two publishers choose to run on Data Graphs? Data Graphs has a suite of outstanding new features aimed squarely at media publishers, that unifies content graphs, CMS, publishing metadata, and provides out of the box services to build your apps upon. In essence, Data Graphs can be used as the ultimate no-code publishing linked-media platform.
Manhattan Sideways had the added requirement of being able to query and render its entities geospatially on a map of New York. Geospatial capability is something Data Graphs has out-of-the-box.
Production & Stage Management
A unified model for publishing
The CreativeWorks model (ontology) is widely used in publishing, being pioneered by publishers such as the BBC, the IPTC and was also adopted by Google with Schema.org.
Typically this is used downstream or alongside existing publishing systems to capture metadata about content. The approach we adopted with Data Graphs was to put a CreativeWork graph model front and centre at the very heart of the publishing system.
Resolute Square primary media assets are podcasts, videos, live events, articles and images. The CreativeWorks model we built in Data Graphs reflects this, with those content classes being subclasses of CreativeWork as shown: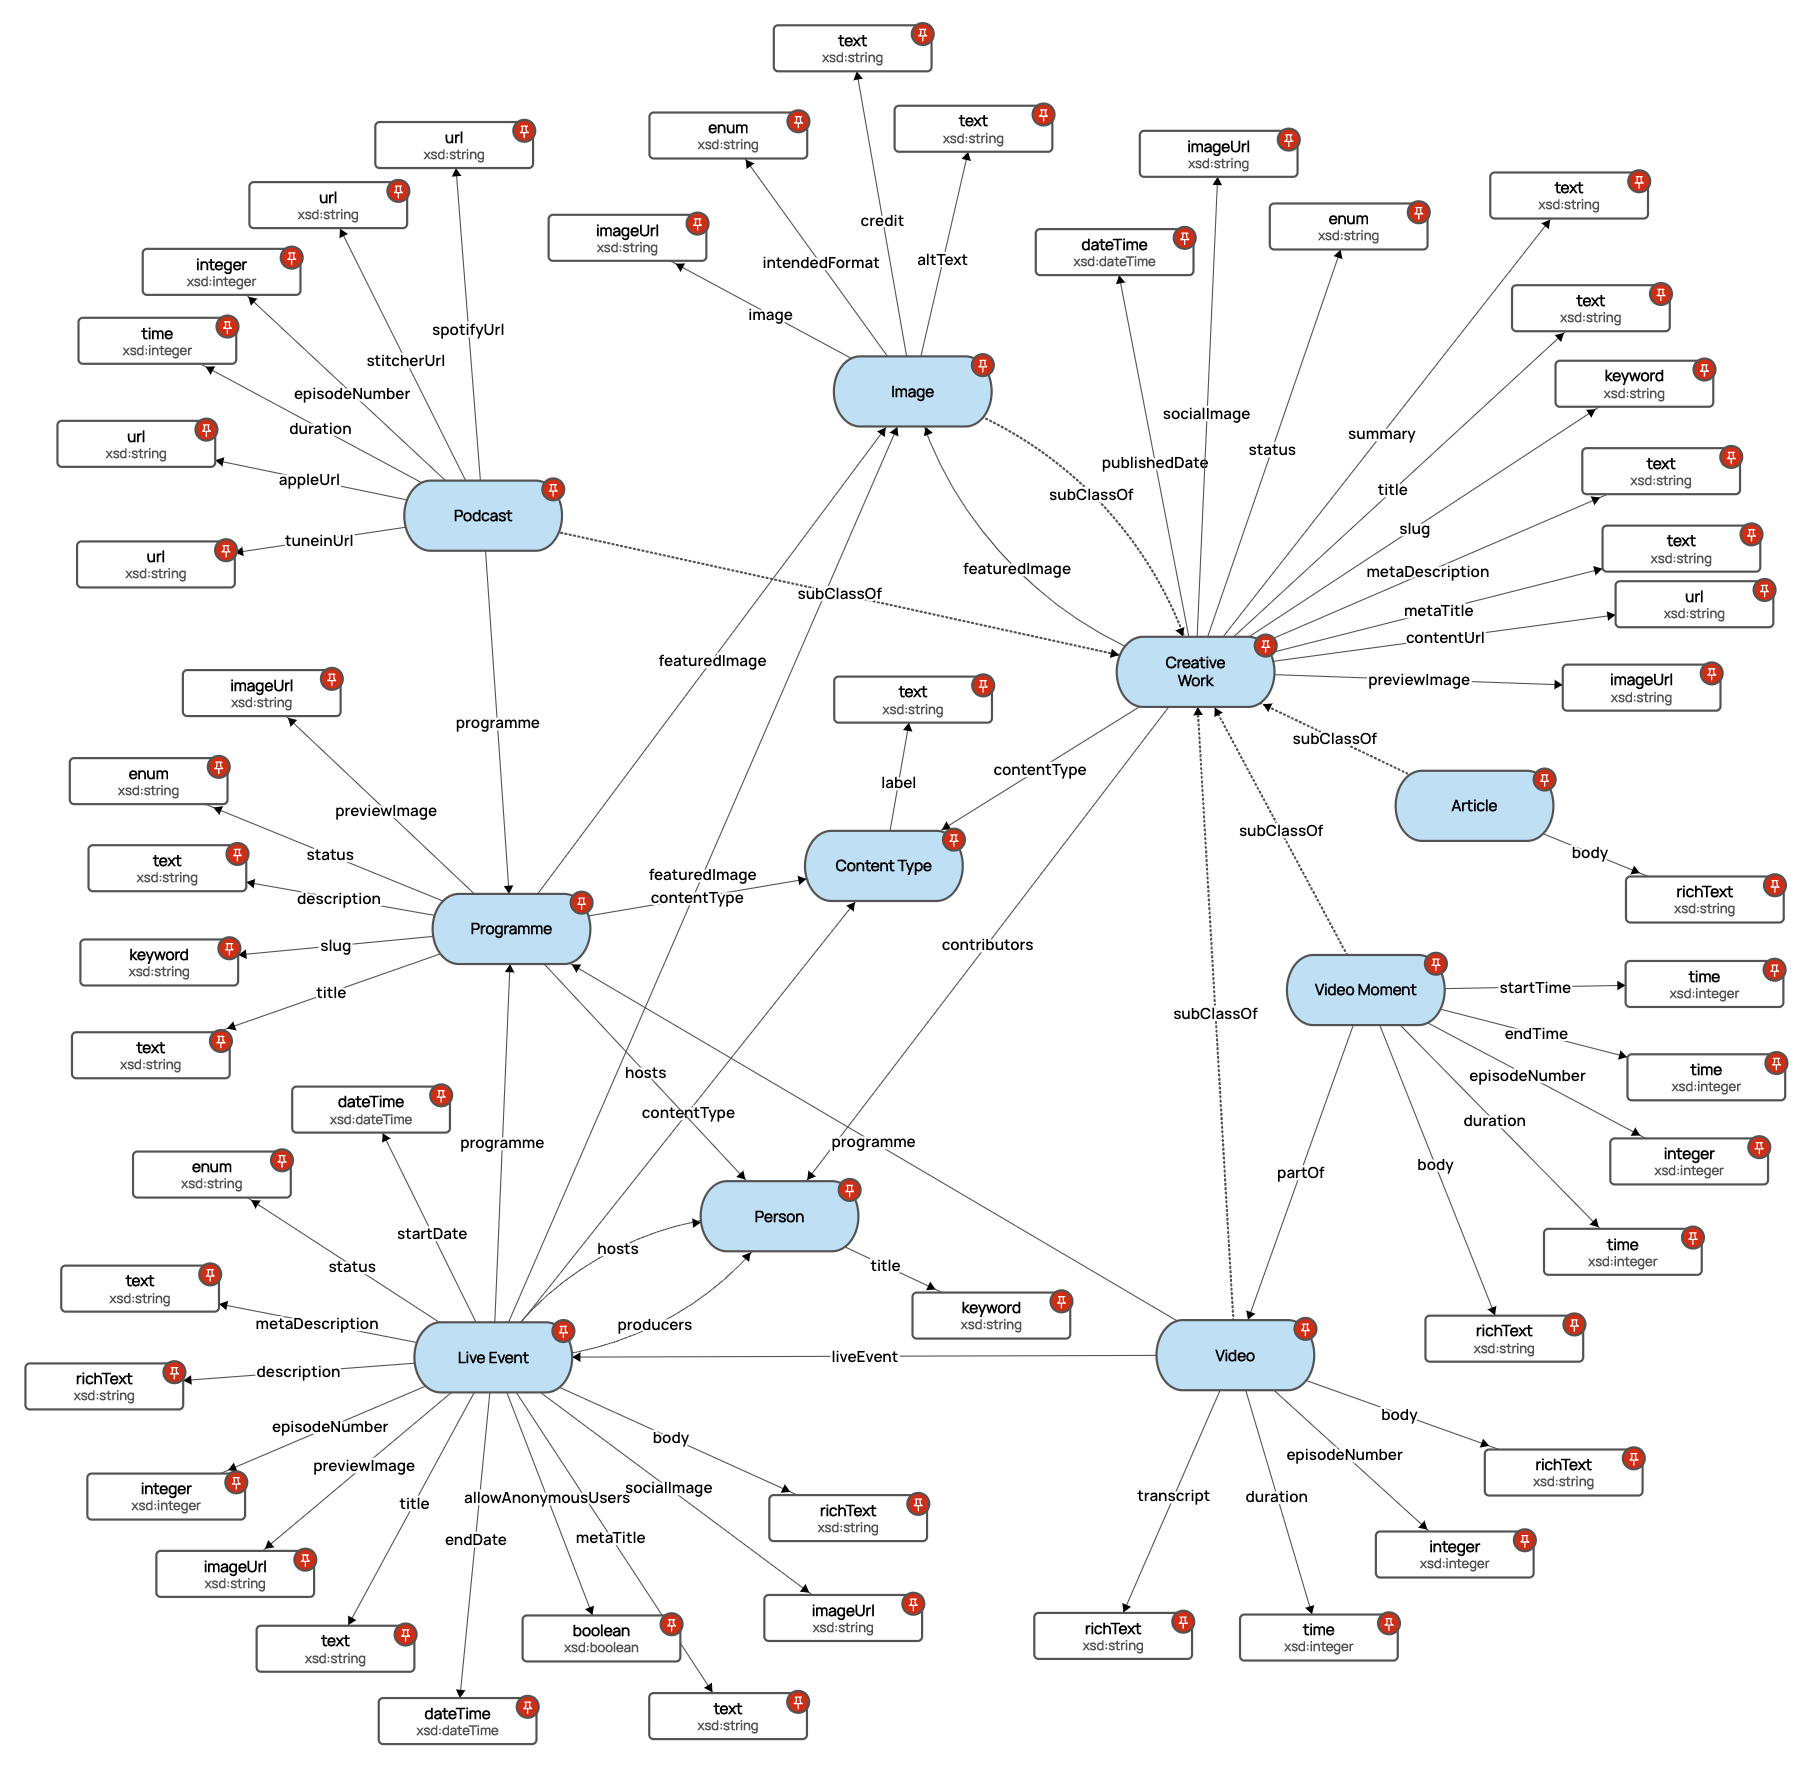
For Resolute Square we then connect the Creative Works model to a model of the politics domain, using the commonly used patterns of `about` and `mentions` relationships between the Creative Works and domain entities: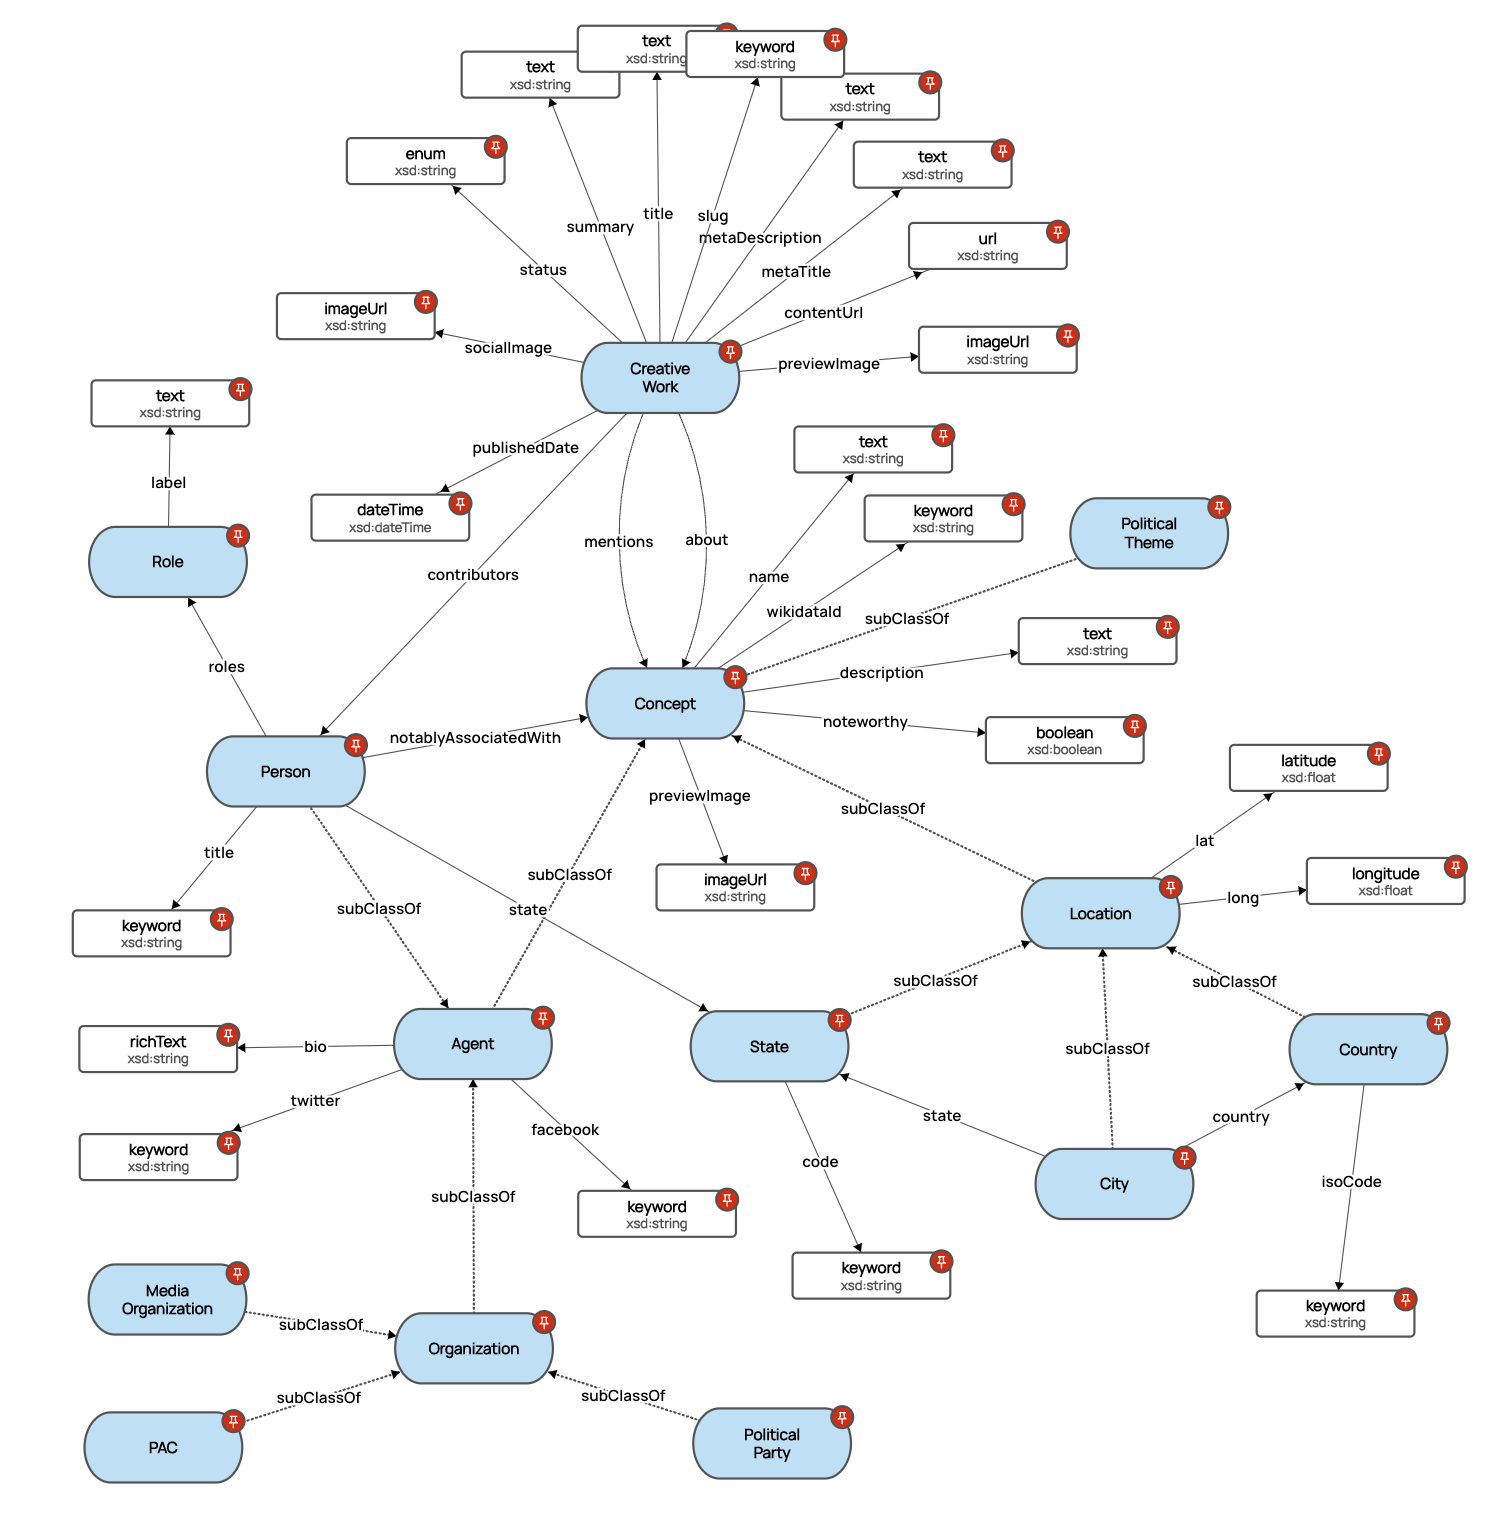
Architecture and Time-to-Market
Technically Data Graphs provides the core back-end for both apps in a headless Graph CMS pattern. The Resolute Square and Sideways apps themselves are both server-side ReactJS apps that consume the Data Graphs APIs using our JS SDK, brokering API calls and handling authentication.
With Resolute Square using the Data Graphs web hooks for event based integration, we connected directly to Perfogram’s interactive live streaming platform, so as the editorial team scheduled live shows in Data Graphs, these were sent to the Perfogram platform for automated show production. Similarly the Subscription and User management SaaS used by the Resolute Square application was able to push subs and anonymised user analytics data into Data Graphs to provide a 360 degree single customer view on content and users in the graph.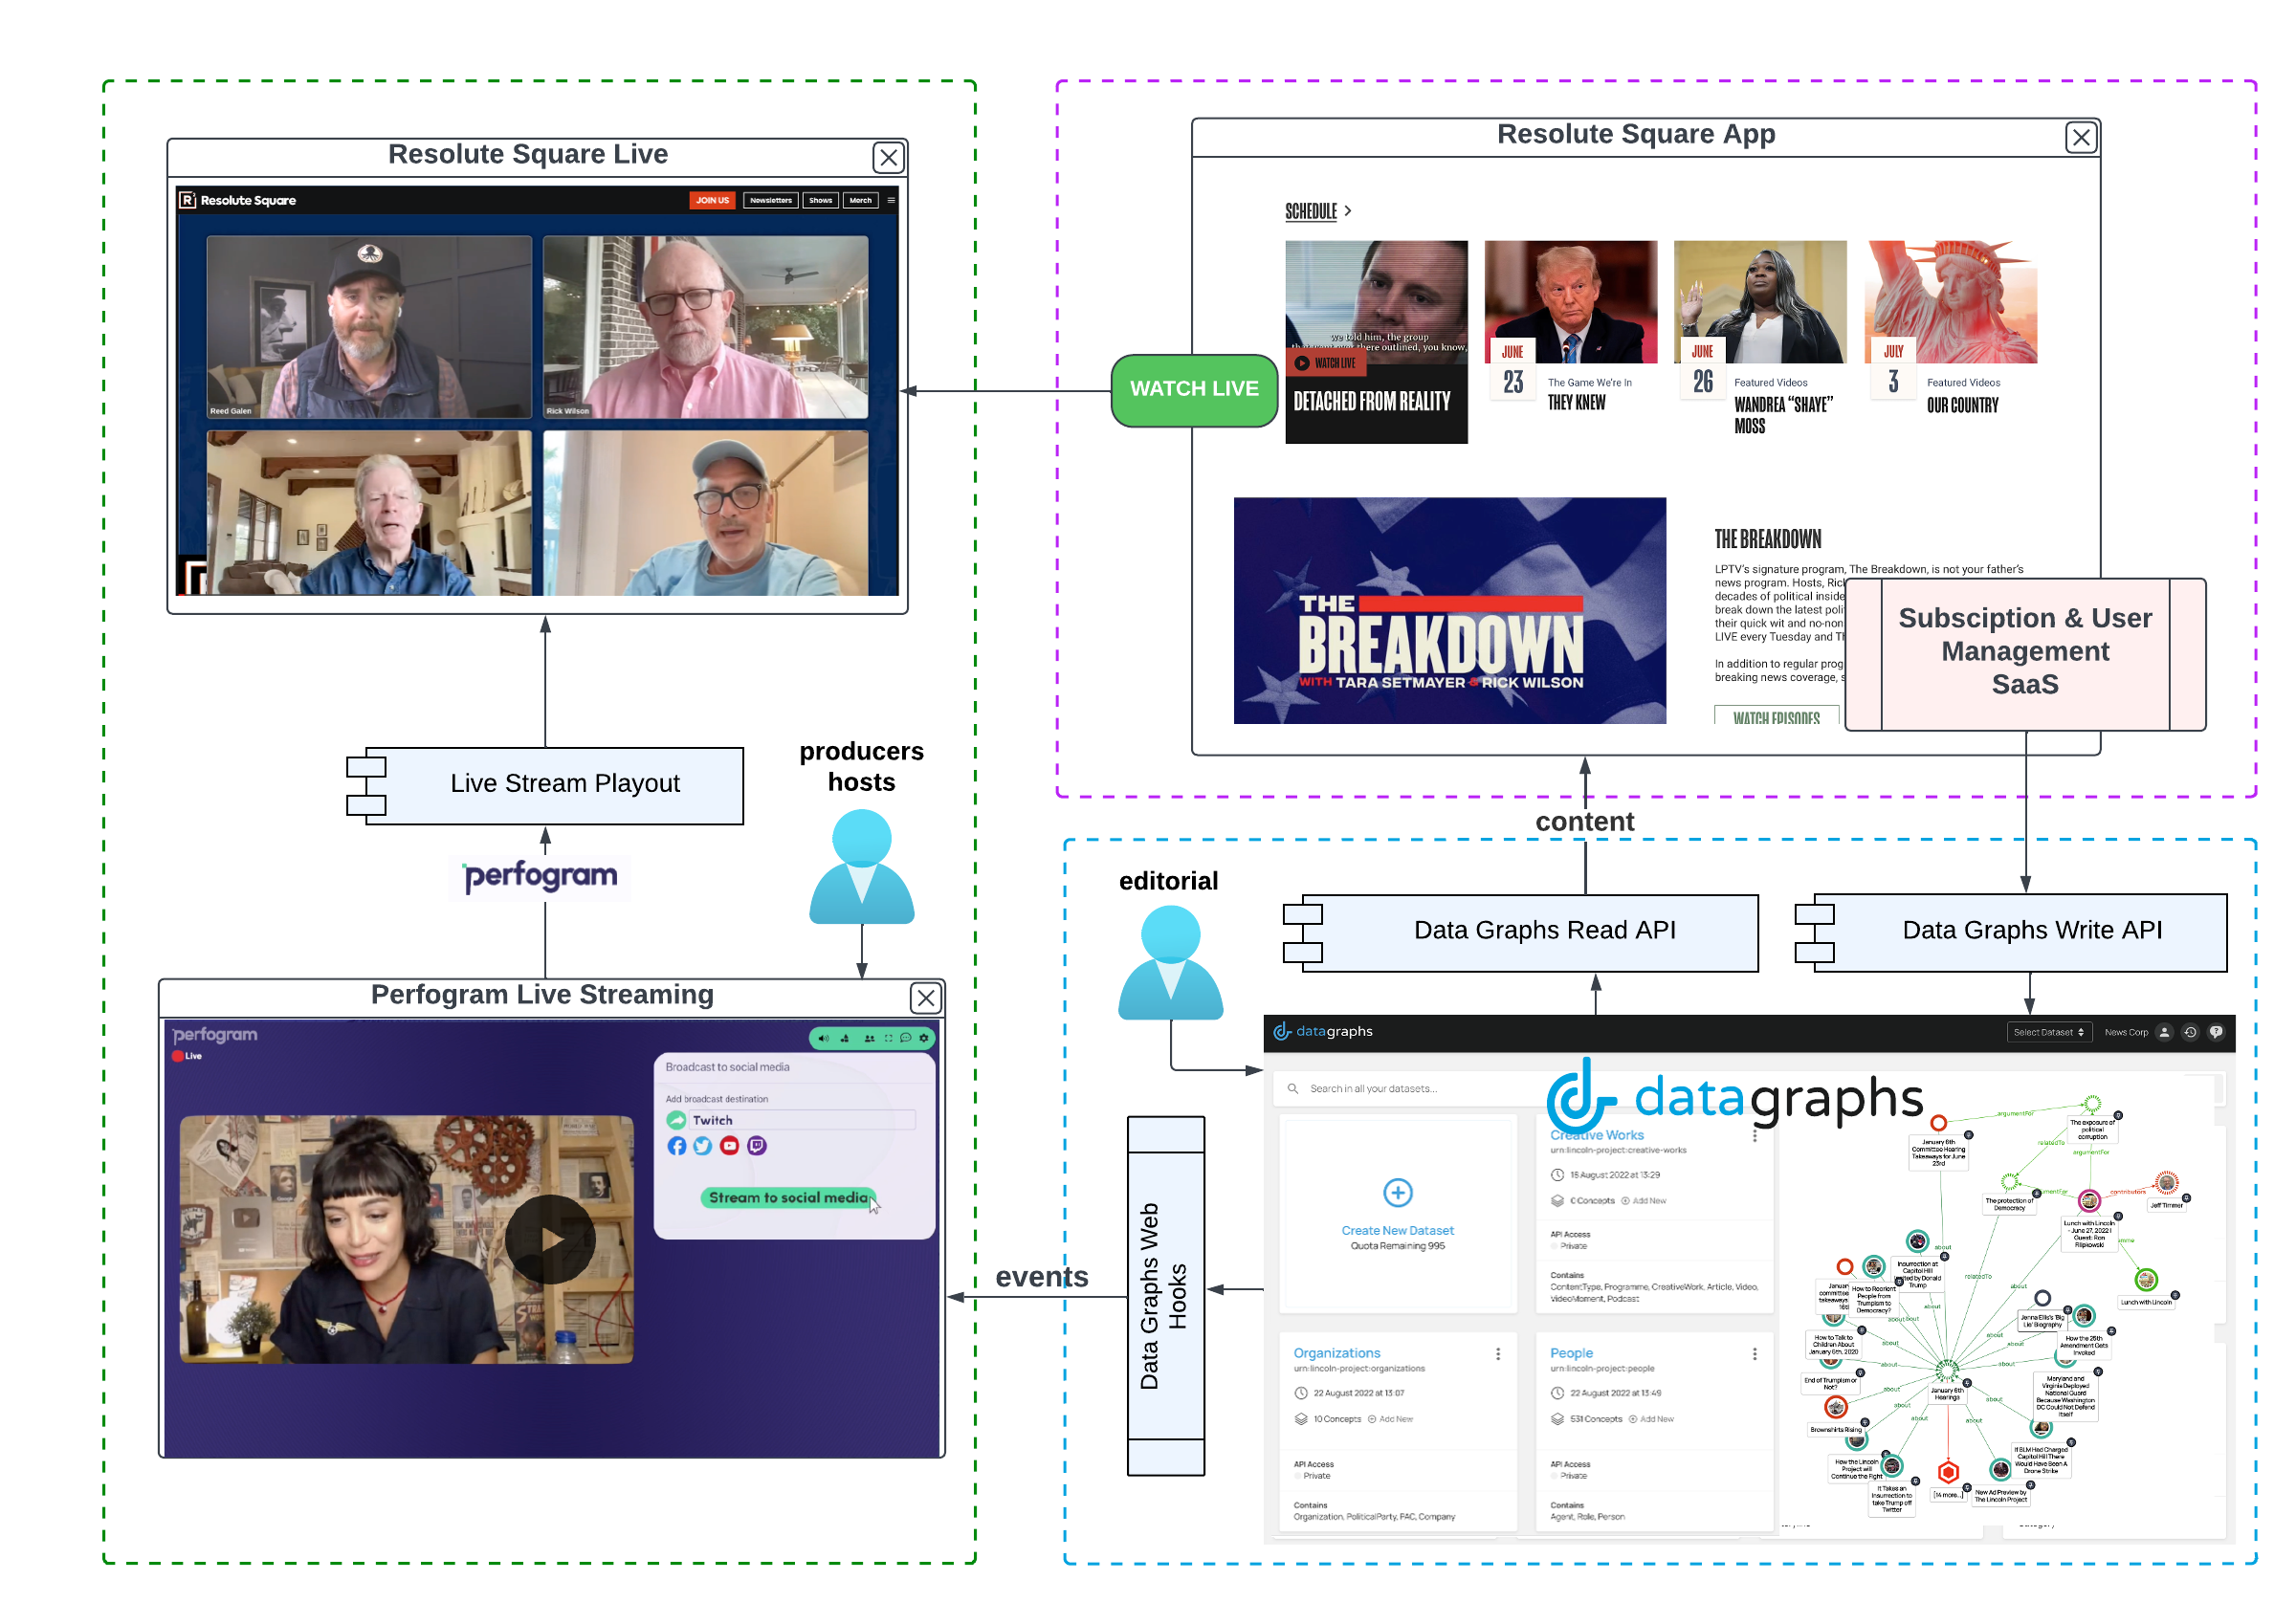
All media aggregations, media renderings and user journeys are delivered using Graph queries via the APIs. The APIs are rocket fast, very expressive, robust and very scalable. Critically the APIs are graph-aware and adapt automatically to the graph model as it evolves.
What does this mean? It means that as you evolve your product and the underlying graph domain model, you no longer have to modify back-end code (APIs or services) to keep up with the model changes. The cost of maintenance is reduced, and the total cost of ownership is predictable and low. A product owner building on a platform like Data Graphs need only focus on designing and building their app - their own product differentiators, drastically reducing time-to-market, and time-to-value. It is the ultimate no-code back-end for virtually any app.
Special Effects
So what is the next generation of a Content Graph?
A Graph CMS - a Graph DAM, where data and content live side-by-side, completing each other. A comprehensive linked-media platform where media assets and metadata are equal first class citizens of the graph.
Data Graphs does just this - you can reference and view media directly in the graph, you can upload images and have them hosted by the linked-media platform with full compression, cropping, face detection, and image manipulation recipes built in.
You can author rich text (html) content directly in the graph, just like any contemporary web based CMS.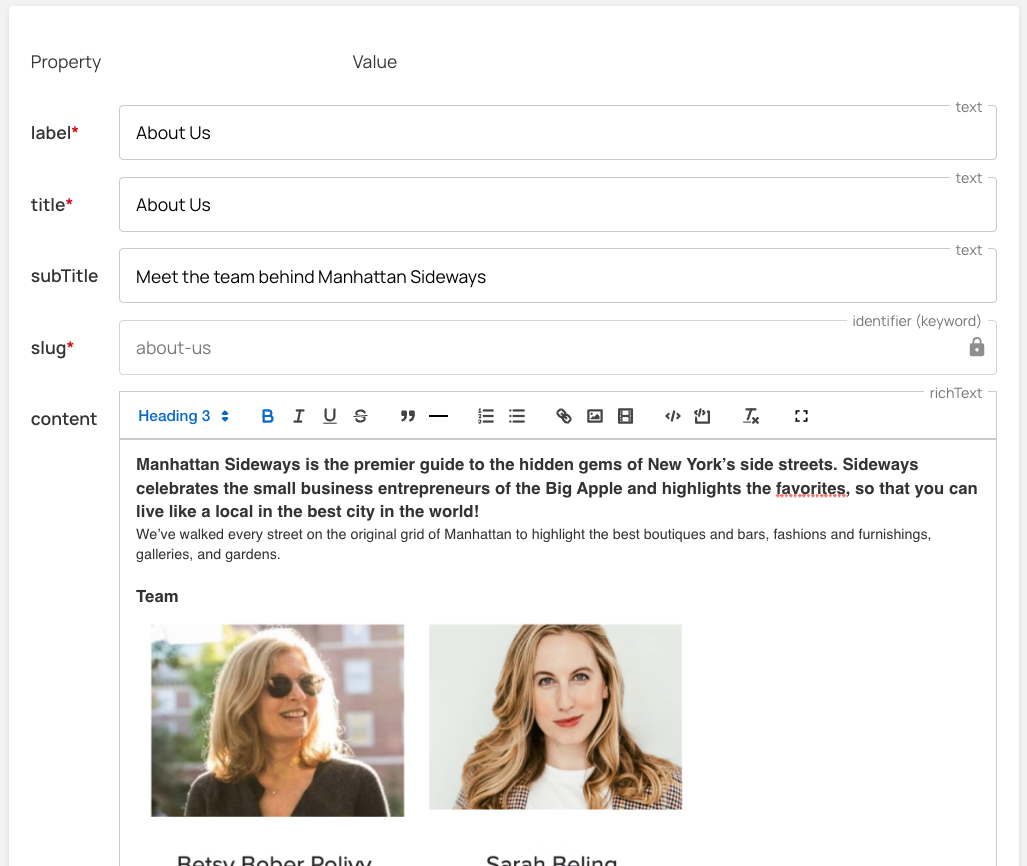
You can play videos directly in the graph, and with our Video Moment add-on you can visually segment your videos into moments, and associate them dynamically with graph entities directly in the UI.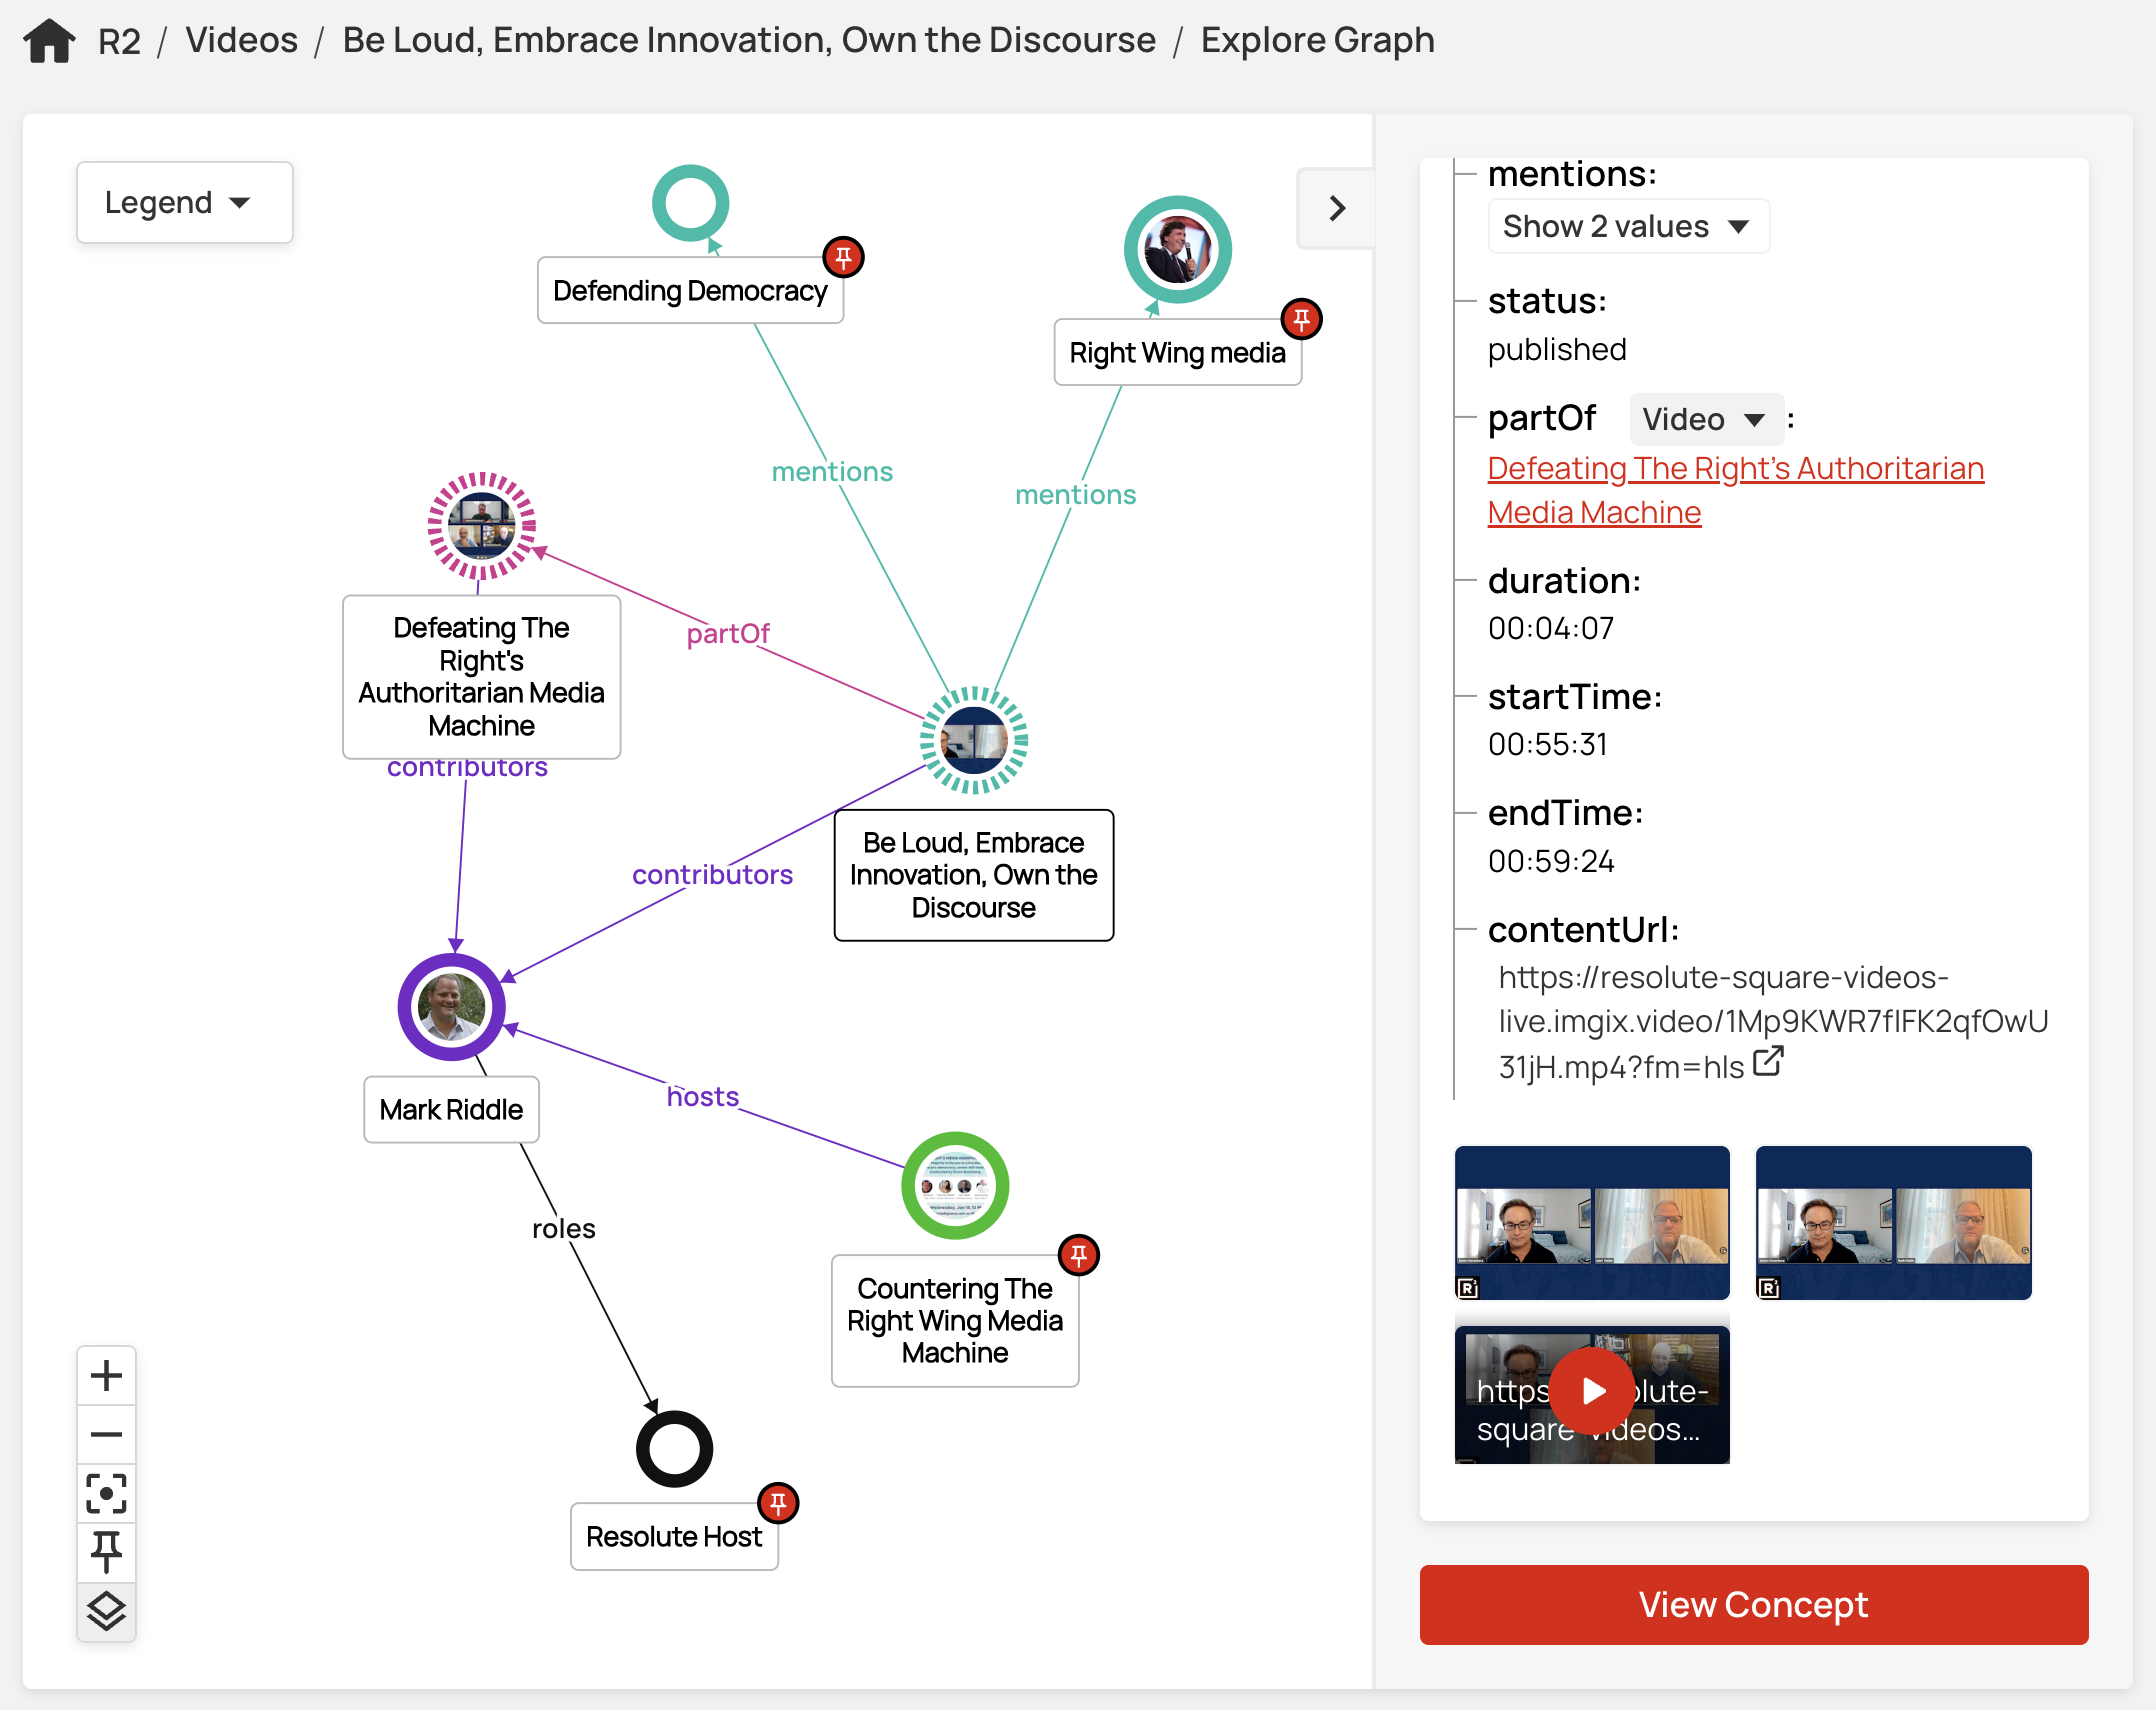
Season 3 - FASTer
Coming soon, content graphs are set to advance further into the realm of FAST TV.
Free Ad Supported TV has become a big big thing in just two years - the rise of platforms such as PlutoTV, Tubi and Amagi have propelled FAST into the mainstream. Media rights owners are moving to realize this new lucrative revenue stream with their own FAST channels. The next level of FAST TV will be graph powered, describing all the media assets in a content graph, a true linked-media platform for streaming and auto-curating FAST and VOD Channels. Watch this space..
Production Costs
Enterprise SaaS platforms always seem to flash expensive warning signs in the eyes of a procurement manager, but is this type of SaaS data platform expensive and what is the alternative? The alternative is building your own, and with this comes (and we all know this to be true):
- a long time to market (minimum 6 months , typically > 1 year)
- high risk of your proposed platform not delivering up to expectations, and with graph database platforms, it's too easy to end up building something that resembles the chaos of a popcorn machine
- an expensive development team (possibly not experienced in graph technologies)
- your own cost of infrastructure and maintenance
- you still need to build the value-deriving app(s)
- higher product and process management overheads
- high total cost of ownership
With the SaaS approach you get a platform engineered and designed by a team with years of experience of data architecture and graph technologies, all for the cost of a fraction of one good developer per year.
A platform ready to go on day 1 of your project that includes hosting and maintenance, predictable costs, and ultimately a considerably shorter time-to-market, lower risk, and much much lower total cost of ownership.
The Wrap Party
Along with some outstanding new features in Data Graphs, not least its new domain modeling tool and Cypher query capability, its ability to manage media and content in the graph really does take content graphs to the next level. However, the real story we are telling here is one of speed to market, ease of use, agility, and extremely high utility.
Choosing a SaaS based Knowledge Graph like Data Graphs minimizes your cost, your risk and your time-to-value. It gives you an information backbone for a vast array of potential use cases and innovation. Its instant-on backend and flexible model gives you an unmatched speed-to-market for innovative new products and an ideal launch-pad for experimenting with new product ideas and apps.
Data Graphs is the easiest to use, highest utility knowledge graph in the world.