Knowledge Graph Visualization in Data Graphs
In my last blog post, I introduced our new SaaS product Data Graphs - a cloud hosted Knowledge Graphs as a Service platform - effectively lowering the barriers to entry into knowledge graph adoption. Data Graphs not only makes it trivially easy to spin up a knowledge graph for a domain or project, but provides a very intuitive user interface for curating and managing your data within, along with search, discovery and integration using a richly featured API.
Since then we have been busy rolling out new features, the most striking of which are the new visualisations. Data Graphs now lets you automatically visualize your domain model, and lets you navigate your graph data visually too.
The Domain Model
This visualization is a superb way to verify the domain (or ontology) model you have created in Data Graphs accurately reflects the true nature of your domain and the semantic relationships between classes of concepts are as you intended. This visualisation lets you see the structure of your schema, including all primitive data properties, relationship properties, and any subclasses you have defined.
A typical pattern is to draw your domain model first in some external tool, or on paper or whiteboard, then construct the schema in Data Graphs. Now you can visually verify if the models align.
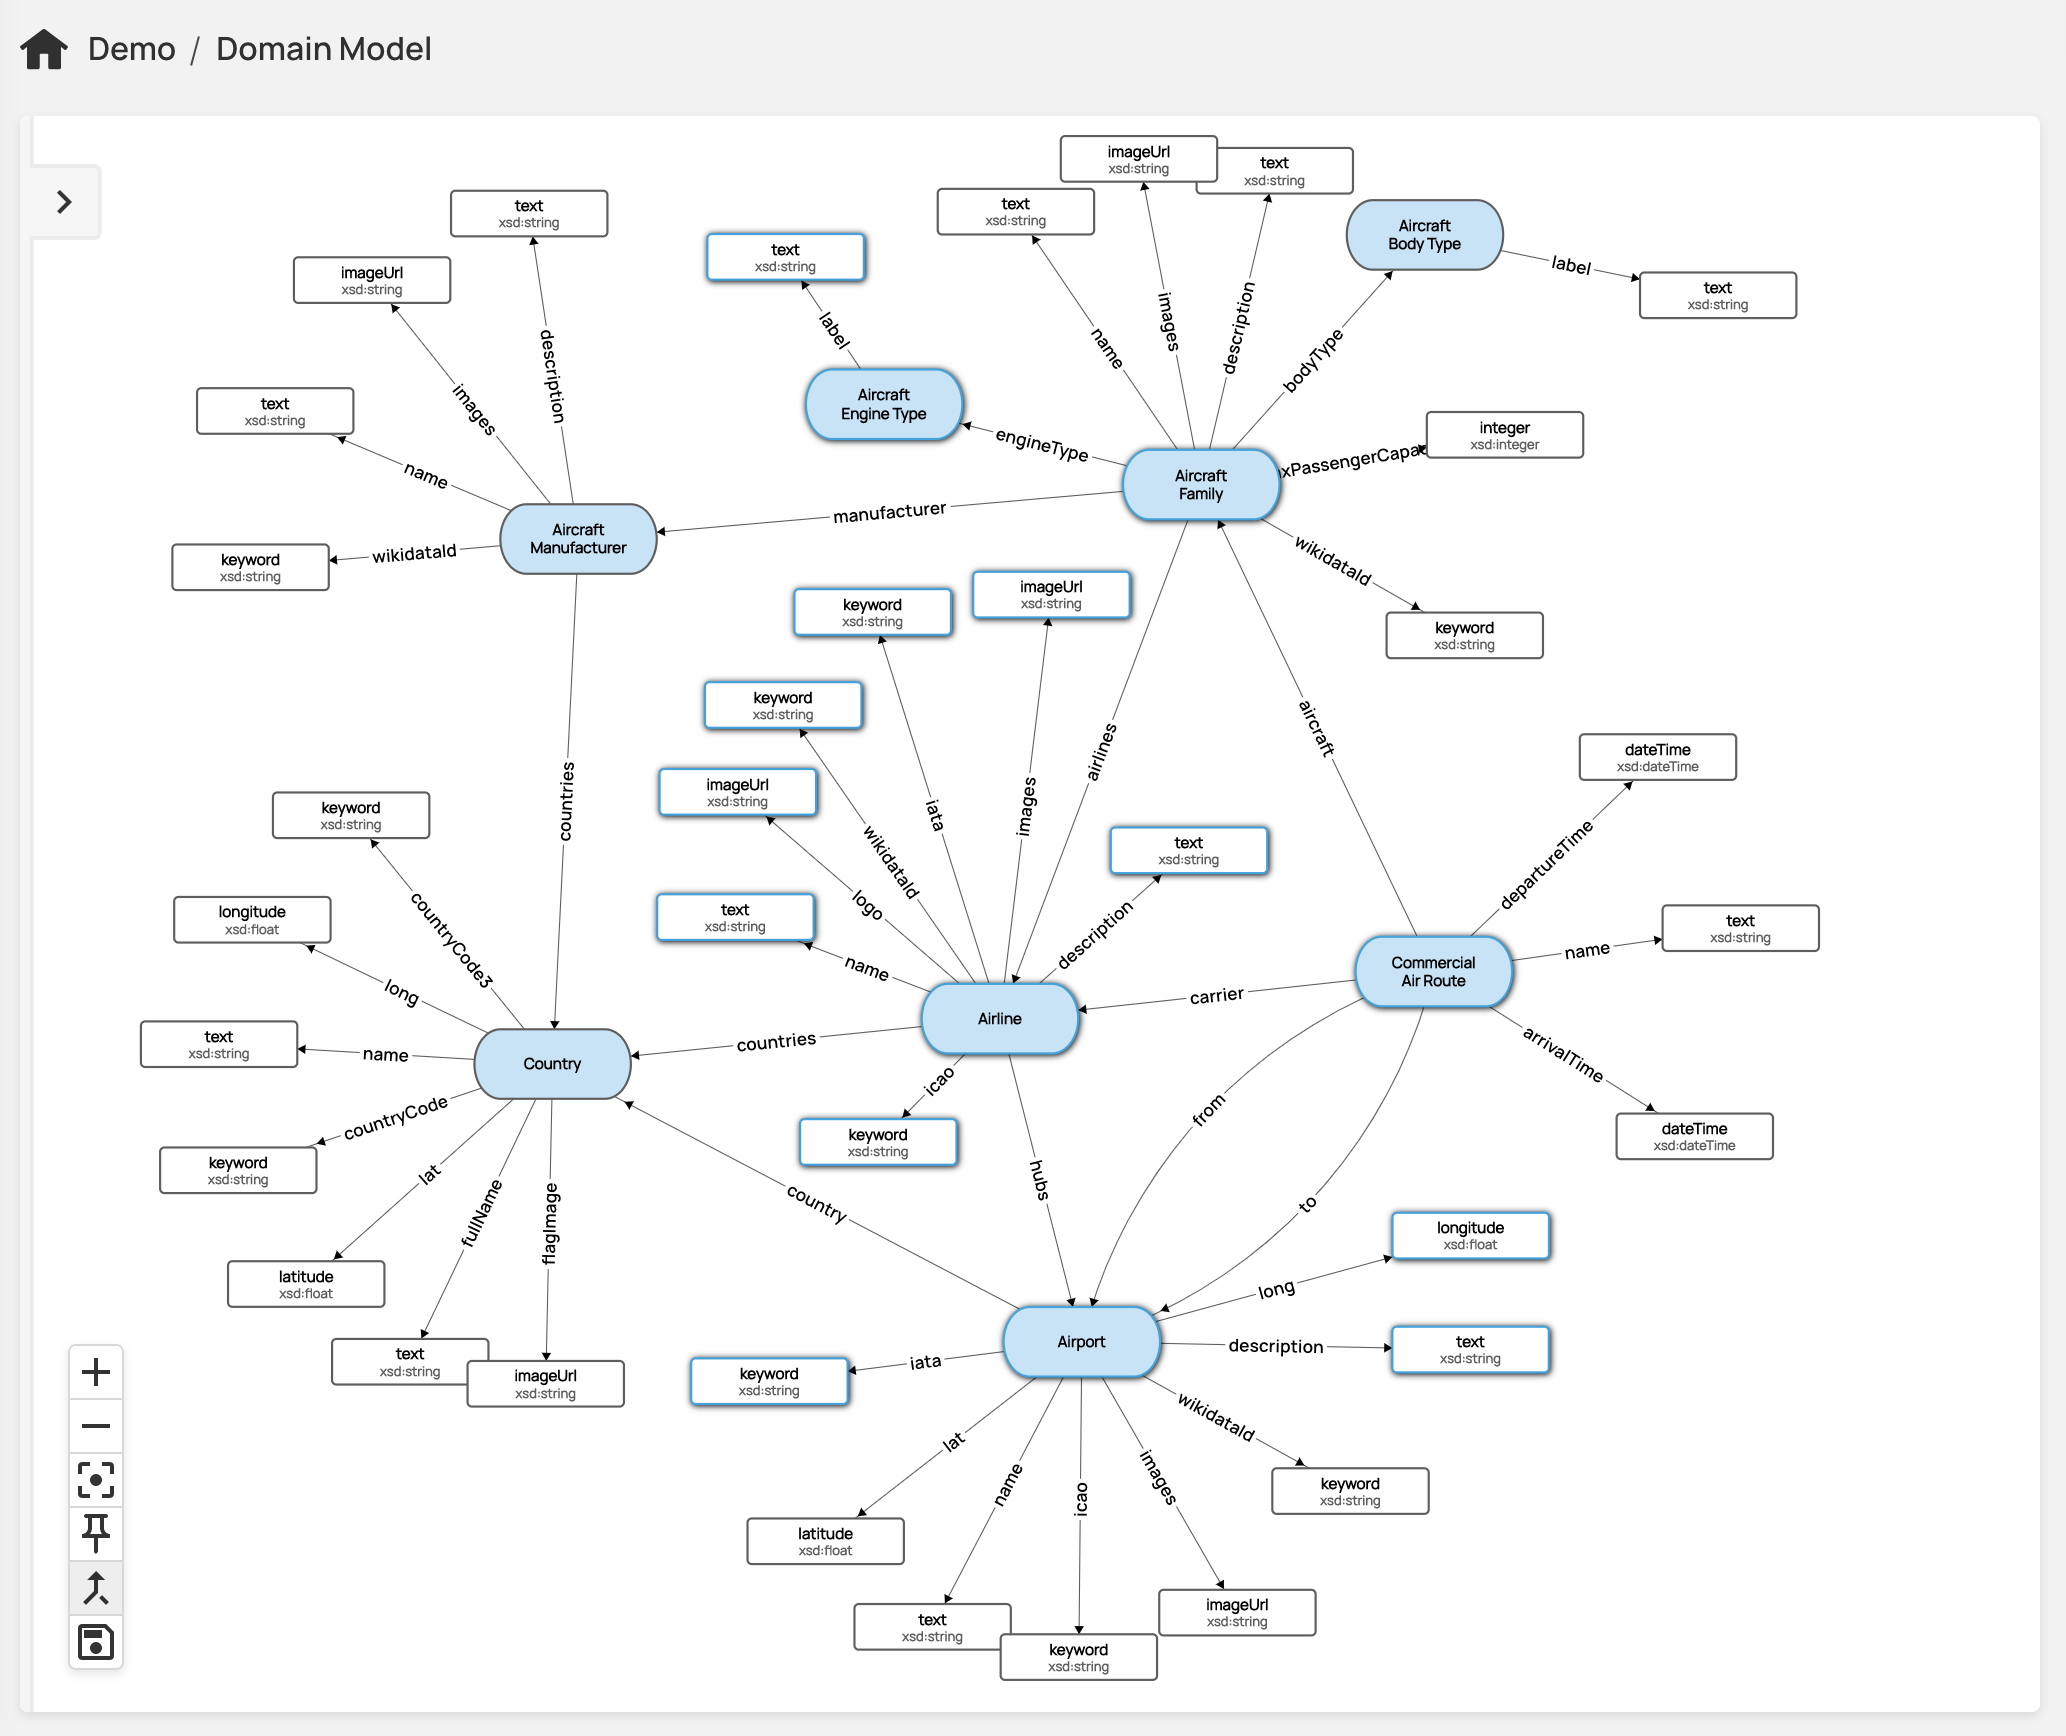
The domain model is visualized using a force-directed graph. If the automatic render is not perfect, you can use the controls to adjust the layout. Each node can be pinned and moved simply by dragging it to the position you prefer. You can pin all nodes using one of the control bar buttons on the left of the diagram. Subclass relationships can be toggle on / off, and you can also remove/prune classes using the sidebar that lists all the concept types in your project. When happy with the layout, you can save it, so next time you view it, it will retain the visual changes you have made.
Graph Explorer
You can explore your knowledge graph visually starting from any concept in your datasets.
There is an option in the concept view screen to “explore graph”. Clicking this will open the data visualization using the concept selected as the starting node.
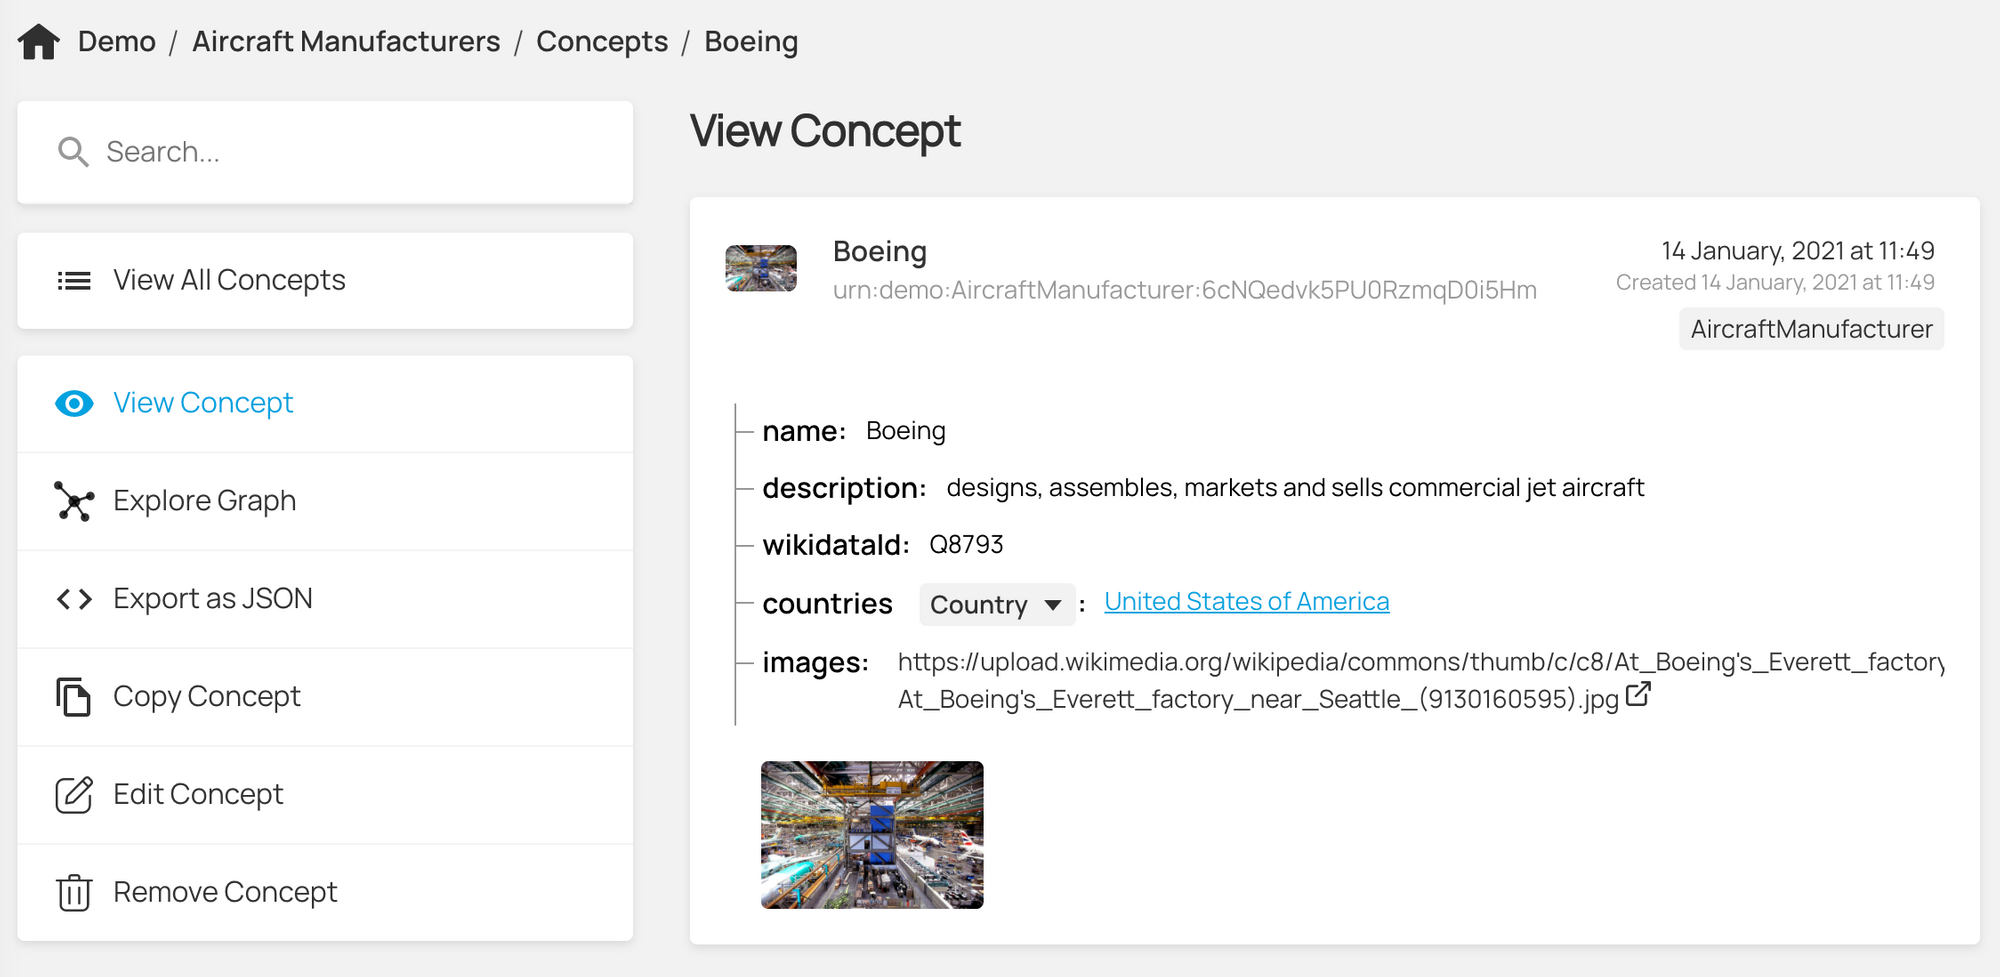
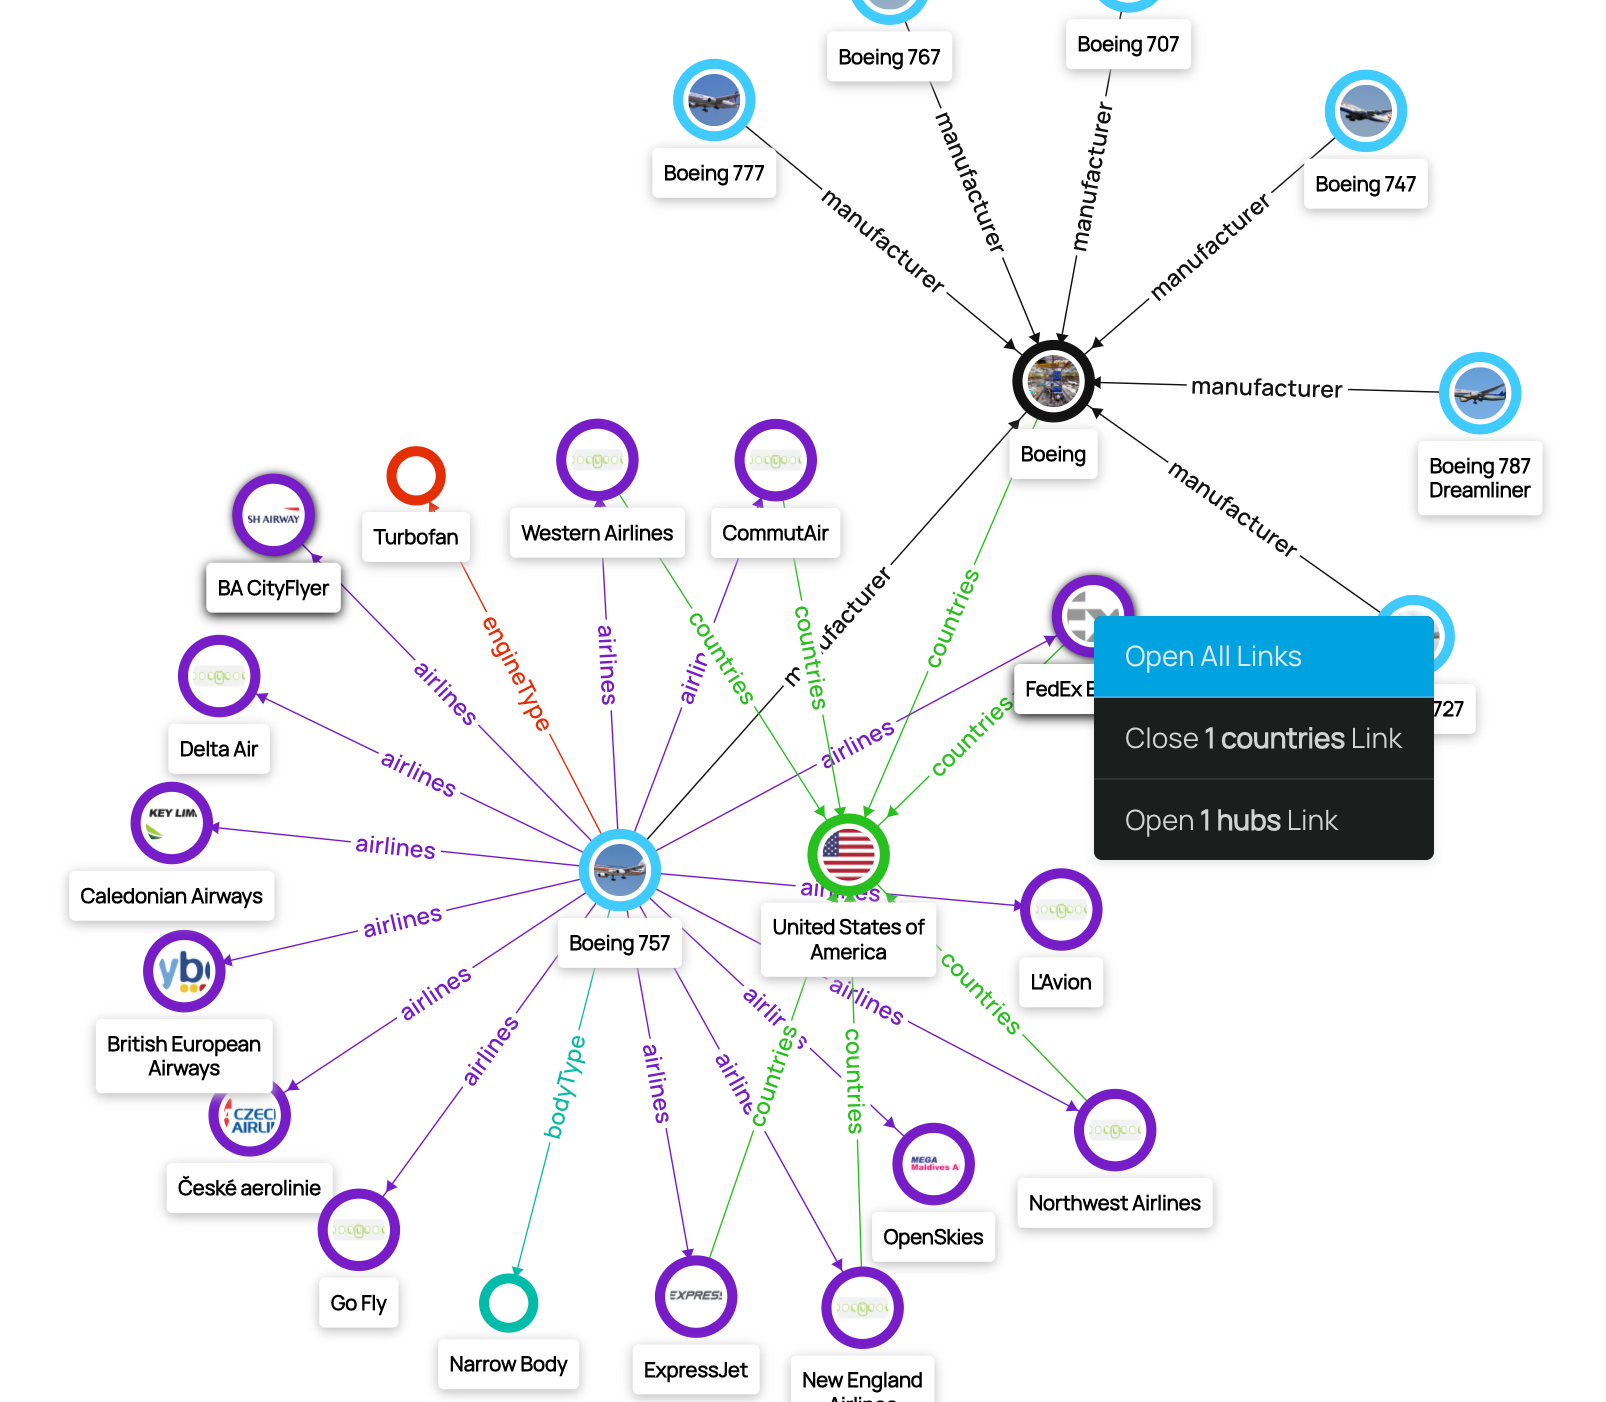
The graph opens and you then have the ability to explore the graph. Clicking on a node in the graph opens all its inbound and outbound relationships. It also renders the data about the node selected in the sidebar on the right.

If a concept has a preview image defined, these will be rendered as the canonical image for each node.
To navigate at a more granular level, right clicking on a node will open a context menu where you have the option to open or close specific relationships, or prune the node itself from the graph visualization.
Like in the domain model, holding and dragging a node pins it the place you move it to.
I hope these are helpful. We have plans to continually improve these visualization features over the coming months.